How to Draw System Design Diagrams in Interviews
1,308 words · 7 min read
Disclaimer: This post reflects my personal views and does not represent the views of my employer or my community.
Caveat: This was written with research assistance from AI tools, but I curated the content, edited the draft, and cross-checked the shortcuts.
Related readings from this blog:
- How to approach a system design question - the 45-minute plan the board follows
- Design a URL Shortener - the design drawn three ways below
- Drawing the Board - the short lesson version of this post
Why the drawing matters
I have sat on both sides of the design round. The candidates who do well are the ones the interviewer can follow. A clean board does half of that work. A messy one makes a good design look confused.
The tool changes from company to company. The habits do not. So this post has two parts: the rules I use on every question, and a quick tutorial for the three tools I meet most often. All the lessons on my Teach page use the same board, so you can see the rules applied thirty-five times.
The rules for every question
- Words on the left, diagram on the right. Requirements, the numbers, core entities and the API go in a column on the left. The diagram grows on the right.
- One layer per row. Client on top, then the edge (load balancer, gateway), then services, then data. Requests flow down.
- Label boxes with the real tech. “Cache (Redis)” and “Links DB (Postgres)” say more than “Cache” and “DB”.
- Solid numbered arrows for the main path. Number them 1, 2, 3 in the order a request travels. Then you talk through the design by pointing at numbers.
- Dashed arrows for everything else. Responses, control traffic, async jobs and failure paths are dashed.
- No crossing lines. If two lines cross, move a box. Crossings are where interviewers get lost.
- A colour legend. Colour by layer, one colour each for edge, services, cache and storage, with a small key. Red is only for failure.
- A red “what breaks first” note. One sentence next to the box that fails first under load.
- A “numbers to say out loud” block. Requests per second, read to write ratio, storage size. Four or five numbers, written down so you never recompute them under pressure.
- Draw in the 45 to 55 minute order. Requirements, entities, API, data flow, high level, deep dives. Grow the same board as you go. Do not wipe it and redraw. Redrawing burns five minutes and loses the thread.
Two more that happen before the day:
- Practise the tool. Draw two or three full designs in it.
- Ask the recruiter which tool they use. Then keep a template board ready in that tool: the left column headings, the four layer rows, the legend. You start every question with the skeleton already there.
The same design, three ways
Here is one URL shortener drawn in each tool. The browser hits a load balancer and API gateway. The redirect service checks a Redis cache, falls back to Postgres on a miss, and returns a 302. The shorten service takes blocks of a thousand codes from a Redis counter and writes one row.
1. Excalidraw: my favourite
Excalidraw is free, runs in the browser, needs no account, and looks hand drawn. It is the tool I reach for first, and it gets the job done.
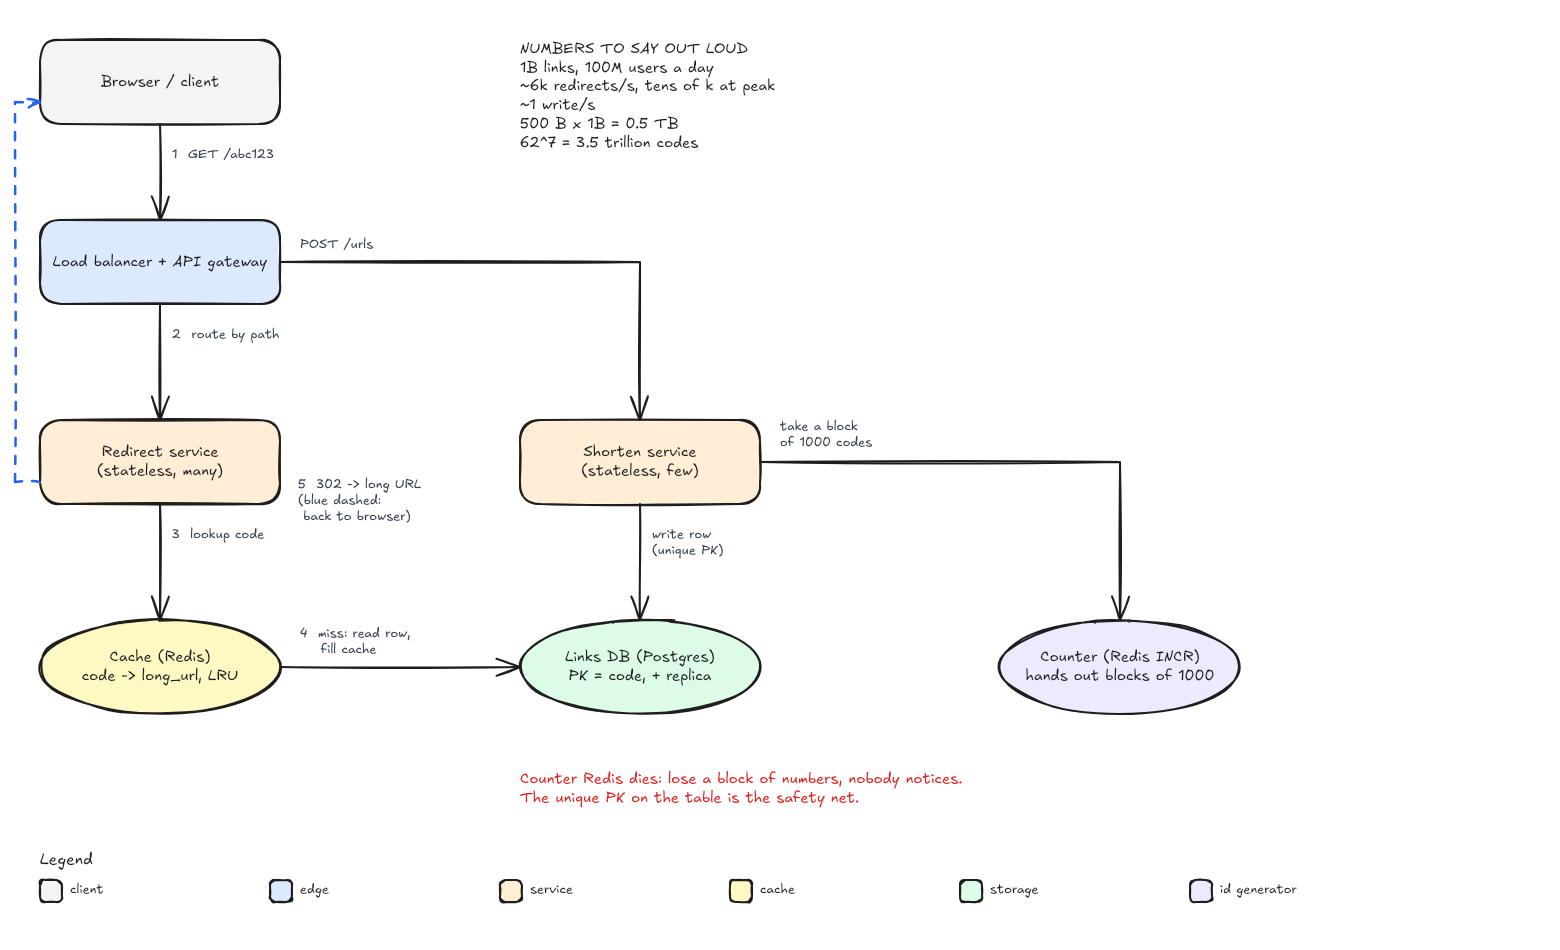
- Learn the tool keys. R rectangle, O ellipse, A arrow, T text, F frame, V select. The number keys work too: 2 rectangle, 4 ellipse, 5 arrow, 8 text. Q locks the tool so you can draw five boxes in a row.
- Turn on the grid. Ctrl+’ (Cmd+’ on a Mac) toggles it. Boxes snap, rows line up, and the board looks planned.
- Bind arrows to shapes. Draw an arrow and drop its end on a box. It sticks, so when you move the box later the arrow follows. Hold Ctrl (Cmd) while drawing if you want a loose arrow instead.
- Duplicate, do not redraw. Ctrl+D or Alt-drag copies a box with its style. Put the diagram in a frame so you can export just that part.
- Share and save. Share, then Live collaboration, gives the interviewer a link that updates as you draw. Export image saves a PNG. Keep a library of your usual boxes (client, gateway, service, cache, database, queue) and drag them in.
2. Google Docs with a Drawing
Many companies send a Google Doc link and ask you to work in it. That is fine. The drawing sits right under your written requirements, so the doc column and the diagram live in one place.
Here is the URL shortener as a Google Doc with a Drawing (read-only).
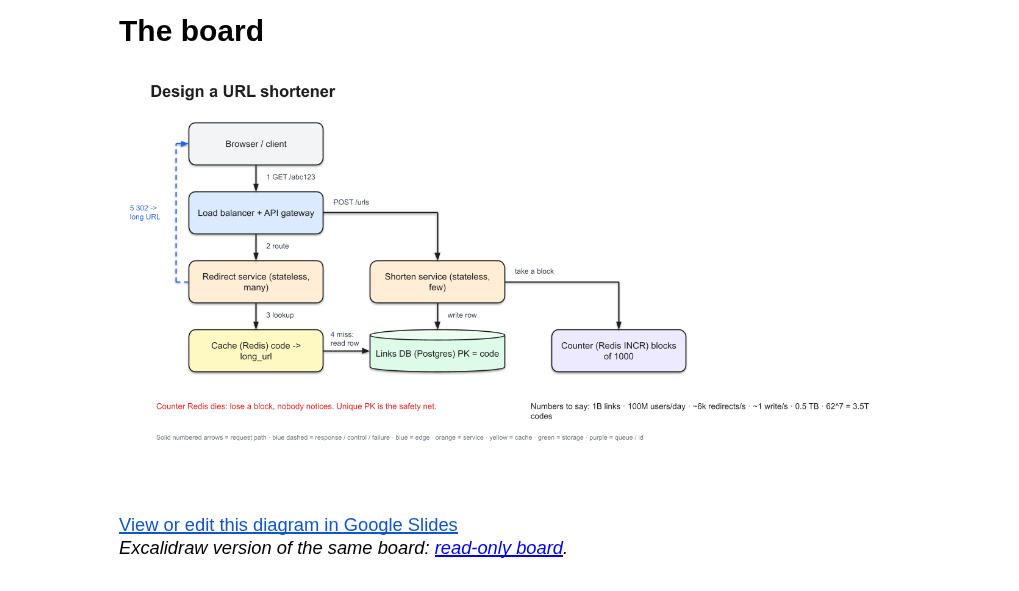
I have also backfilled a Doc for every design lesson on the Teach page. They are all in this Drive folder.
- Open the canvas. Write the requirements first as plain text. Then Insert > Drawing > New.
- Draw boxes with the Shape tool. Pick a rectangle, drag it out, and type straight into it.
- Connect with elbow connectors. Under the Line tool, choose Elbow connector. Hover over a box and blue connection points appear. Snap both ends to them and the line follows when you move the box.
- Tidy up. Ctrl+D duplicates a box. Select a row and use Arrange > Align and Arrange > Distribute to line it up.
- Save and close, then keep growing it. The drawing drops into the doc as an image. Double-click it to edit later. To share a copy afterwards: Share > General access > Anyone with the link > Viewer.
3. ASCII: when all you have is a text editor
Some rounds give you a bare text editor. CoderPad is common. Amazon’s LiveCode is a bare editor with no drawing tool at all. Sometimes it is just a chat window. Then you draw in text.
In ASCII the doc column goes on top, because the editor is narrow. Here is the same board:
REQUIREMENTS  shorten URL (alias, expiry); redirect < 100 ms;
              codes never repeat; available over consistent
ENTITIES      ShortURL(code PK, long_url, owner, expires_at)
API           POST /urls -> short URL     GET /{code} -> 302
NUMBERS       100M DAU | ~6k redirects/s | 1000 reads : 1 write
              ~1 write/s | 1B links x 500 B = 0.5 TB
LEGEND        --> request path   ..> response   !! breaks first

           +-----------+
CLIENT     |  Browser  |<...................+
           +-----------+                    :
             |1 GET /abc123                 : 5 302 Found
             v                              :
           +-----------------------------+  :
EDGE       |  LB + API gateway           |..+
           +-----------------------------+
             |2                    |a POST /urls
             v                     v
           +--------------+      +-------------+
SERVICES   | Redirect svc |      | Shorten svc |
           +--------------+      +-------------+
             |3                    |c       |b
             v                     |        v
           +--------------+        |      +------------------+
CACHE      | Cache: Redis |        |      | Counter: Redis   |
           +--------------+        |      | INCR, 1000/block |
             |4 miss               |      +------------------+
             v                     v
           +-----------------------------+
DATA       | Links DB: Postgres          |
           +-----------------------------+

!! A viral link hammers one cache key. Fix: local cache + CDN.
!! Counter down: no new links, but redirects keep working.
- Use a monospace editor. Every coding pad is monospace already. In a chat, wrap the drawing in a code block.
- One layer per line. Put a label on the far left (CLIENT, EDGE, SERVICES, CACHE, DATA) and stack the rows down the page.
- Keep arrows straight. Only
|andvgoing down,-->going across. Diagonals in ASCII are unreadable. - Number the steps. 1 to 5 for the read path, a to c for the write path. Then the talk track is “step 3 checks the cache”.
- Add a legend line and stay narrow. One line that says what
-->,..>and!!mean. Keep it under about 70 columns so nothing wraps. If you want to practise, ASCIIFlow lets you draw boxes with the mouse, but in the real round you will type them.
Which one should I use?
| Tool | Use when | Watch out for |
|---|---|---|
| Excalidraw | You get to choose, or the company allows any whiteboard | Live link permissions; practise the arrow binding first |
| Google Docs + Drawing | The company sends a Doc, or wants requirements and diagram together | Small canvas, the interviewer only sees it after you save |
| ASCII | CoderPad, Amazon LiveCode, a chat, any bare editor | Line wrapping; drawing too much detail; diagonal arrows |
Pick the tool the company uses, practise it twice, and keep a template ready. Then the board stops being a thing you fight with, and you can spend the round on the design.