GPU and RDMA Cluster Debugging on Linux: Which Tool Looks at Which Layer
12,290 words · 62 min read
Disclaimer: This post reflects my personal views and does not represent the views of my employer or my community.
Caveat: This was written with research assistance from AI tools, but I curated the content, edited the draft, and cross-checked the references.
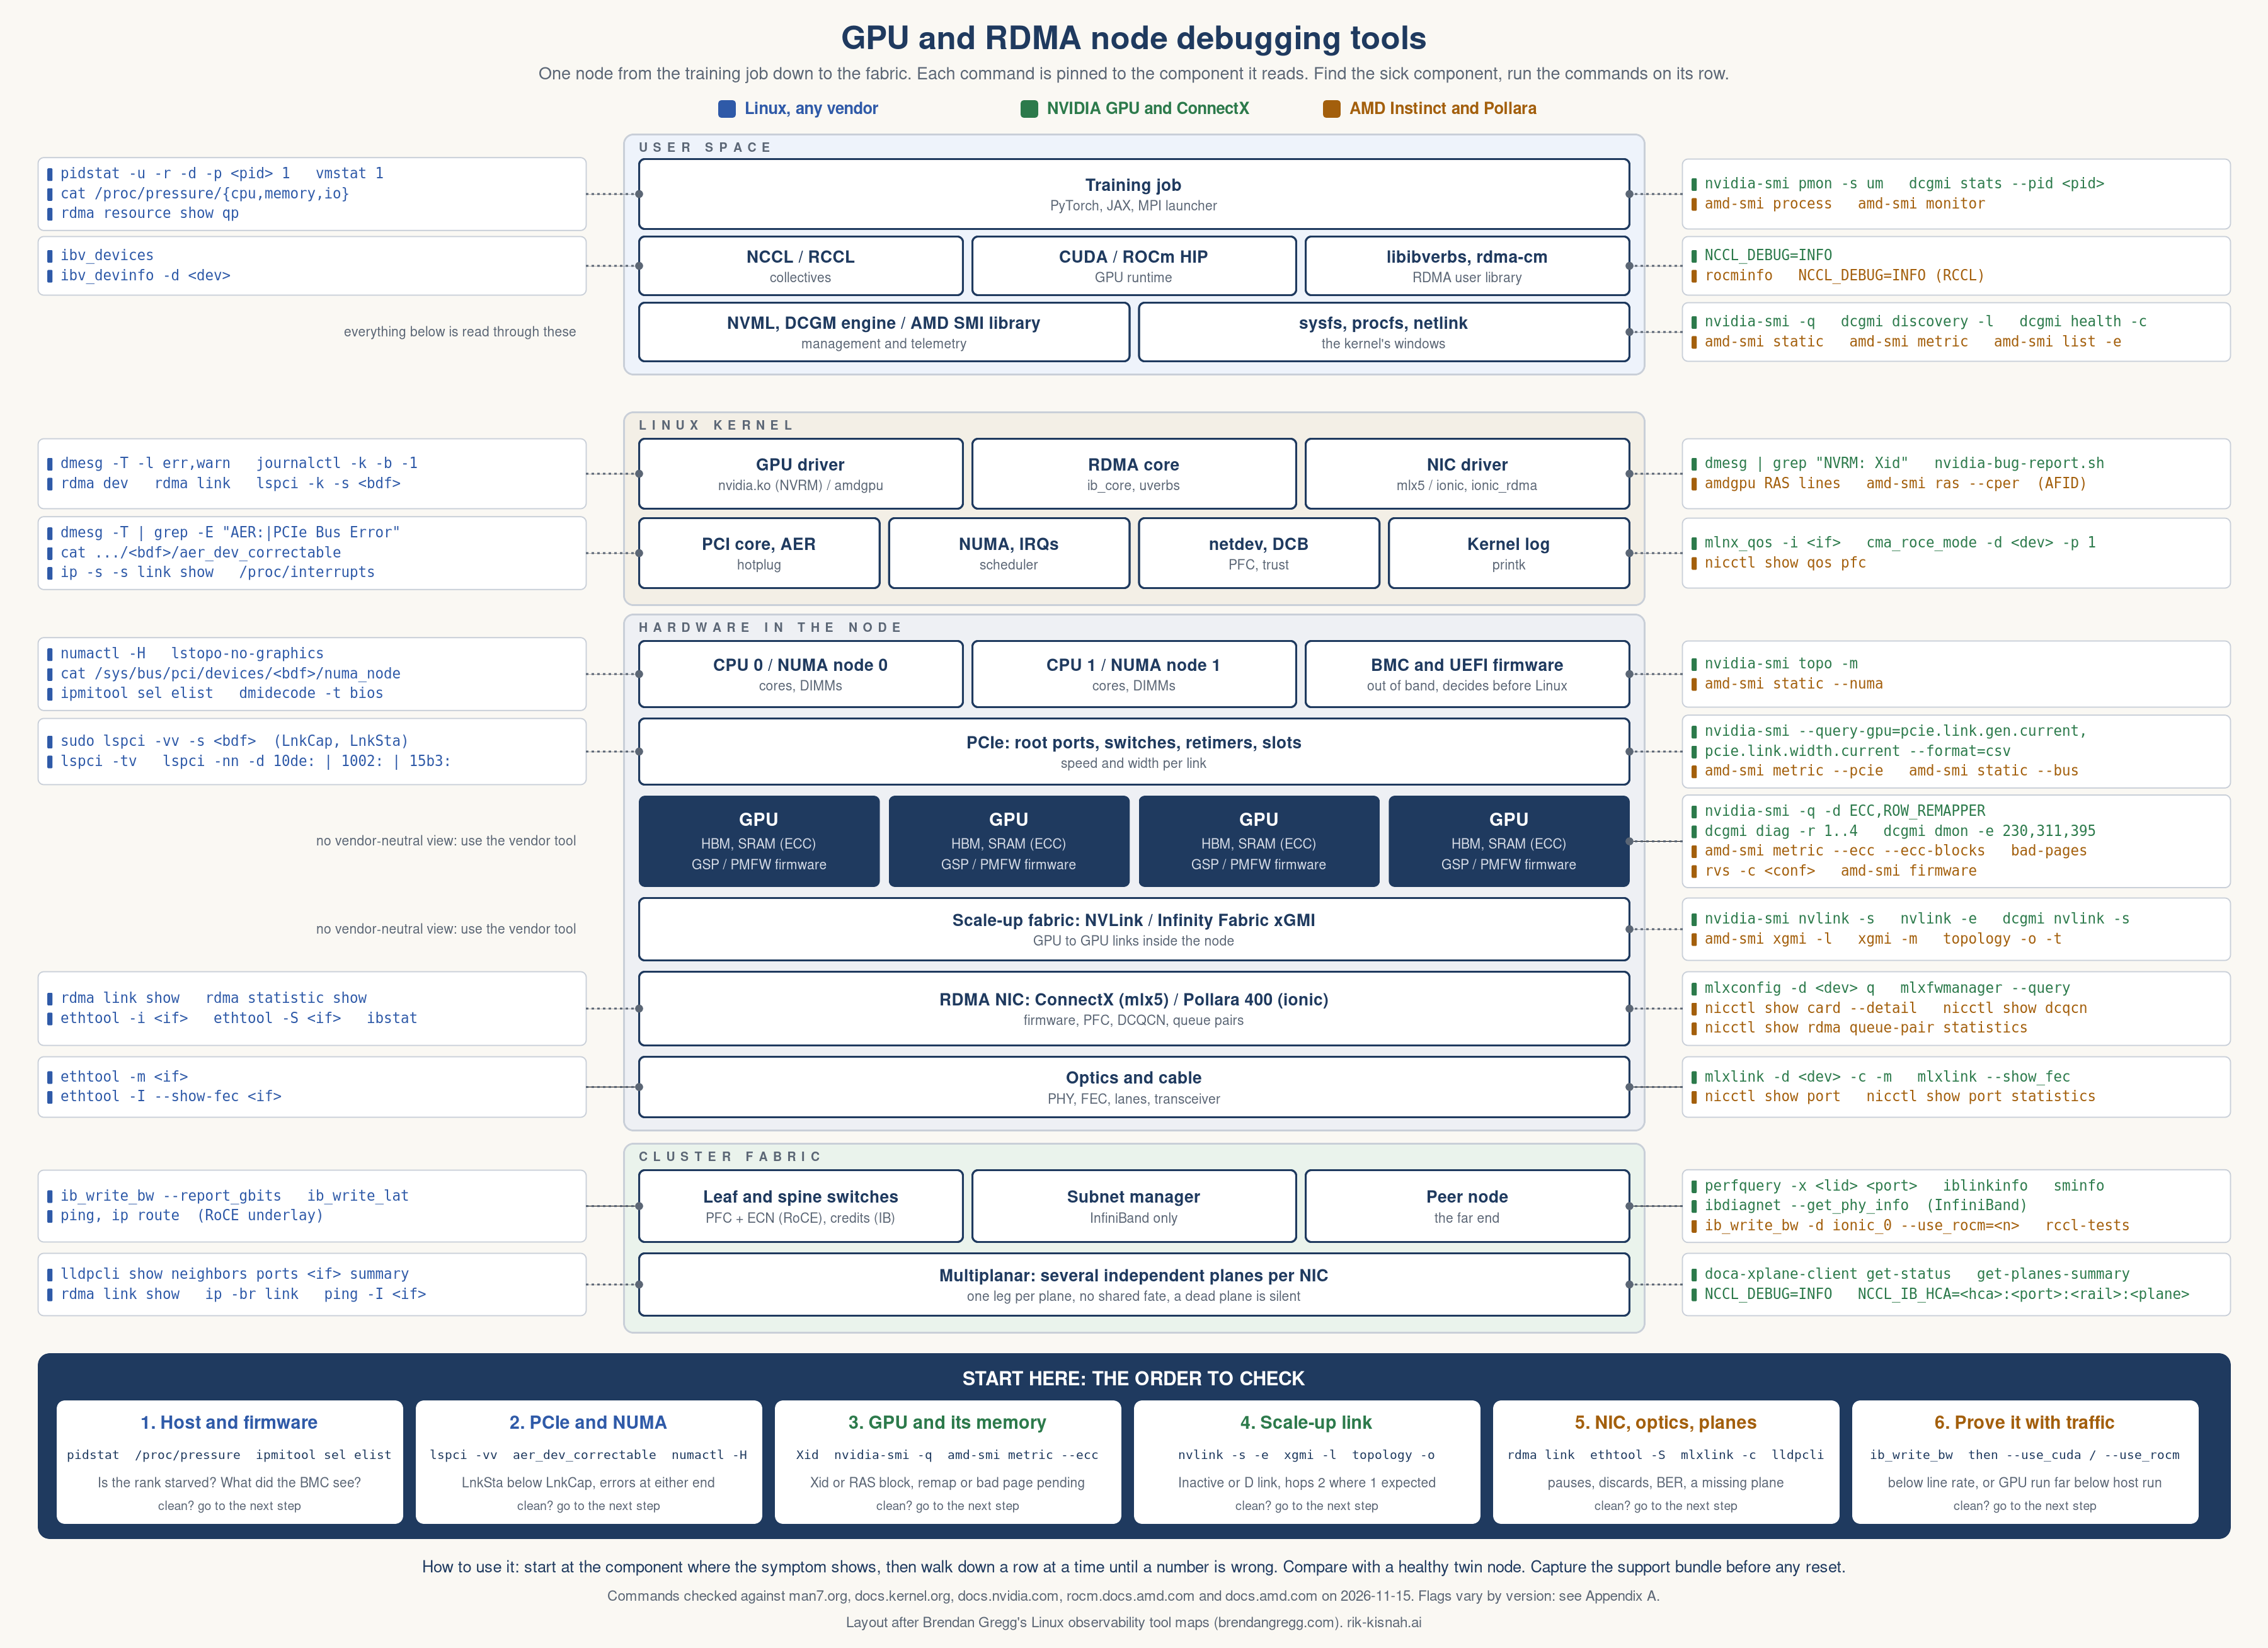
Image: The map above and Figures 2 to 8 are my own drawings from public Linux, NVIDIA, AMD and Oracle documentation. Click any figure to open it full size. A printable PDF of the map is available.
Related readings from this blog:
- The Complete NCCL Reference Guide - the collectives library that fails first when anything below it is sick
- RDMA, RoCEv2 and InfiniBand, Explained to a Ten-Year-Old - the network this post debugs
- GPU Burn-In at Scale - how I test a node before I trust it
Raison d’être of this blog - a blueprint to debug AI Infra from the Operating Systems
When a GPU/AI job fails, the application errors out with NCCL or RCCL errors. My nearly a decade of debugging in this space has shown that errors are very nuanced across different layers. It could be a GPU whose PCIe link is incorrectly trained at half speed, a defective optics cable, or a NIC placed incorrectly.
My mantra: The job sits at the top of this tall stack and reports the failure, not the journey of the failure.
My NCCL guide from last year (well received by the industry) sits on top of the stack. This post covers everything below it. It is a map for navigating each layer - which command to look at each layer and which line matters the most. It covers both NVIDIA and AMD side by side because hyperscalers and some neoclouds offer both. OCI - my employer - offers both options [64] and is worth considering; the leadership has always strategically ensured both have first-class representation and availability for the customers.
Brendan Gregg’s observations inspire me - I am a great fan of his book, and it is, in my opinion, the bible of Systems Engineering / Performance [28] - he draws the Linux stack and pins a tool to each box [65]. The map I have on top of this post is that idea for a GPU node within an RDMA network. It is the one page I actually use and print in my cube when debugging issues. The node runs down the middle: userspace, kernel, hardware, and the fabric. Linux commands sit on the left in blue, vendor commands sit on the right, NVIDIA in green, and AMD in amber. The dark bar along the bottom is the order of things to check in.
Two rows have nothing on their left: the GPU and the scale-up fabric. This is on purpose - Linux sees the PCIe bus and the kernel. It sees nothing inside the GPU. To do that, you need the vendor’s tool (and sometimes NDAs), and the two vendors don’t really use the same low-level drivers or techniques.
In the rest of the post, I walk through the map layer by layer. I show how to measure from the host. Then I show the subsequent layers, from the firmware up to the fabric. The multi-planar (new technology - I will write a separate blog on this) needs its own checks, and six sections show the order in which to run all of this.
The Methodology and mental model: Walk Down, Compare, Trust, Capture
Four steps (I remember that as W, C, T, C every time I am looking at a GPU/RDMA issue).
- Walk down. Start at the component where the symptom shows. Then go one row lower on the map, and again, until a number is wrong.
- Compare with a healthy node. Run the same command on a healthy node of the same shape. A diff finds the fault faster than reading one output cold.
- Trust counters over logs (Always!). Kernel logs are rate-limited. Sticky status bits tell you something happened once. Counters tell you how often.
- Capture before you reset. Run
nvidia-bug-report.sh[27] or AMD’srocm_techsupport.sh[26] first. A reset wipes volatile counters, and with them the evidence.
Step 3 has a number behind it. The kernel limits PCIe error messages to a burst of 10 every 5 seconds per device [2]. A link throwing a thousand errors a second prints the same ten lines as one throwing eleven. The log tells you a link is noisy. Only the counter tells you how noisy.
Step 4 has a cost. NVIDIA says to allow up to an hour for the bug report in rare cases, and offers --safe-mode --extra-system-data if it hangs [27]. A hang is itself a signal: the GPU is not answering.
Explain it to a ten-year-old. The light in your room will not turn on. You check the bulb, then the switch, then the fuse box. You do not start by calling the power company. You look in your sister’s room to see if her light works.
Measure so the numbers tell you what to fix
I have seen many wrong diagnoses come from a good command read incorrectly.
There are four habits you can adopt in your daily routine to avoid it.
Read counters twice. A counter is a lifetime total. It tells you history. Only the change during the fault tells you about the fault. Take a reading, wait a known time, take another, and subtract.
ethtool -S <if> > /tmp/before ; sleep 30 ; ethtool -S <if> > /tmp/after
diff <(sort /tmp/before) <(sort /tmp/after) | grep '^>'
Some counters are built for this. rx_prio3_pause_duration is the time the port spent paused, in microseconds [17]. If it grew by 6,000,000 in a 30-second window, the port was paused for a fifth of that window. That is a number you can act on. A raw pause count is not.
perfquery -r reads the InfiniBand counters and resets them in one step [19]. ibdiagnet --pm_pause_time 60 takes two samples a minute apart and reports only what moved.
Run the test more than once (I recommend three times - because I believe in the power of the trinity). One good run proves little. A link that is fine four times in five looks perfect if you keep the best number. perftest has no option to repeat a whole test [21], so loop it:
for i in 1 2 3; do
  ib_write_bw -d <dev> -x <gid> -q 4 -s 1048576 -D 20 --report_gbits <peer> | tail -3
done
Keep every result. Two modes in the results, one near line rate and one far below, is the signature of something intermittent: a flapping lane, a plane that comes and goes, a pause storm.
Change one thing. Vary message size separately from placement. Vary the node set separately from the firmware. If you change four things and the fault goes away, you have a workaround, not a diagnosis.
Compare like with like. A control node measured cold is a poor match for a suspect that has run hot for hours. Match the time under load, the workload phase, and the neighbors. Yesterday’s benchmark on an empty cluster is not a baseline for today’s on a full one.
Explain it to a ten-year-old. To know if the bath is filling, you do not look at how much water is in it. You look twice and see if the line moved.
Before the GPU: Find out the data that is coming to it
A collective can be slow because one rank arrives late. The network moves every byte at full speed, and the other ranks still wait, because one process is busy decoding data, short of memory, or stuck on a read. A network benchmark passes. The job stays slow. Neither result is wrong.
So before any GPU or fabric tool, look at the process that feeds the GPU. Use the PID of the slow rank or its data loader, not the launcher.
vmstat 1 10                          # r = runnable, b = blocked, si/so = swap, wa = I/O wait
iostat -xz -y 1 10                   # per device: await, aqu-sz. -y skips the since-boot line
pidstat -u -r -d -p <pid> 1 10       # CPU, page faults and disk I/O for one process
pidstat -w -t -p <pid> 1 10          # context switches per thread
cat /proc/pressure/cpu               # time tasks spent stalled waiting for CPU
cat /proc/pressure/memory
cat /proc/pressure/io
[43][44][45][46]. The first line of vmstat is an average since boot. Read the later lines. One trap in pidstat: its %wait column is time spent waiting for a CPU, not waiting for disk. In iostat, compare await and aqu-sz with a healthy twin under the same load. %util is a poor gauge on devices that serve requests in parallel, which is every modern SSD.
The pressure files are the quickest read. Each line reports the share of time that tasks were stalled on that resource. some means at least one task was waiting. full means every task was. The full line for CPU is always zero at the system level, so read some there. They measure waiting, not usage, so a machine can look idle in top and still show pressure.
Containers hide the most common cause. The host is idle, and the job is starved by its own limit.
cat /proc/<pid>/cgroup                              # prints 0::/<path> on cgroup v2
findmnt -t cgroup2                                  # where cgroup v2 is mounted, usually /sys/fs/cgroup
cat /sys/fs/cgroup/<path>/cpu.max                   # quota and period. "max" means no limit
cat /sys/fs/cgroup/<path>/cpu.stat                  # nr_throttled, throttled_usec
cat /sys/fs/cgroup/<path>/memory.events             # high, max, oom, oom_kill
cat /sys/fs/cgroup/<path>/cpu.pressure
[47]. Take two readings a few seconds apart. If nr_throttled and throttled_usec climb while the job stalls, the kernel is enforcing a CPU quota on that container. The data loader runs out of CPU each period, its rank reaches every collective late, and seven healthy nodes wait for it. A faster NIC would change nothing. Check the parent groups too: cpu.stat reports only the group’s own limit, and a quota set higher up shows in cpu.stat.local.
Two more checks cost seconds. numastat -p <pid> shows which NUMA nodes hold the process’s memory [66]. taskset -cp <pid> shows which CPUs it may run on [67]. A data loader pinned to the far socket from its GPU is a placement fault, and it shows here first.
Explain it to a ten-year-old. The relay team is slow. Before you blame the track, check whether one runner was still tying her shoes when the baton arrived.
Layer 0: What got decided before Linux even started
Some faults are settled before the kernel prints its first line (this is the layer most runbooks skip). So it helps to know who decided what, and when.
A server boots in stages. The BMC brings up power. Firmware initializes memory and walks the PCIe buses. A boot loader loads the kernel, from disk or from the network. The kernel starts with a small initramfs, then loads drivers. The GPU driver is close to last.
Three things from the early stages matter later:
- PCIe links train in hardware when reset is released. Firmware then enumerates whatever came up [39]. Linux enumerates again from what firmware describes. A link that trained at half width before the kernel started is still at half width when you log in.
- NUMA layout comes from firmware. The ACPI tables describe which CPUs, memory and devices sit together. That is where
numa_nodegets its answer, and why-1is a firmware finding, not a Linux one. - AER ownership is negotiated. The kernel asks firmware for control of PCIe error reporting. If firmware keeps it, the errors go to the BMC and
dmesgstays quiet [2].
This is why I treat the BMC as a second witness (Always!). It runs on its own processor and keeps its own log. It was watching when the host was not.
dmesg | grep -i -E 'efi|acpi|numa'      # what firmware handed over
sudo dmidecode -t bios                   # firmware vendor, version, date
sudo dmidecode -t memory                 # DIMMs as firmware saw them
sudo ipmitool sel elist                  # the BMC event log, with sensor names
sudo ipmitool sdr type Temperature       # every temperature sensor the BMC has
systemd-analyze                          # time spent in kernel, initrd and userspace
[38]. On newer platforms the same event log is served over Redfish, under a LogServices path on the BMC. The exact path is the vendor’s choice.
One practical rule follows from this - when a node is wrong straight after boot, compare firmware versions before you compare anything else. On a rack-scale system the compute trays, the switch trays and the top-of-rack switch should run firmware versions that were tested together.
Explain it to a ten-year-old. Before school starts, the caretaker unlocks the doors and counts the chairs. If he counted only eight chairs in your classroom, the teacher cannot fix that by taking the register again.
Know the machine first: the baseline numbers by platform
You cannot call a number low until you know the ceiling. These are the vendors’ own published figures for the platforms most of us run - NVIDIA and AMD side by side. Read the notes under the table before you compare anything to them (the notes matter more than the table).
| HGX H100 / H200 | GB200 NVL72 | Instinct MI300X / MI325X, 8-GPU | |
|---|---|---|---|
| GPU memory | 80 GB / 141 GB HBM3e | 372 GB HBM3E per superchip of two GPUs | 192 GB HBM3 / 256 GB HBM3E |
| GPUs in one scale-up domain | 8 in a server | 72 in a rack: 18 compute trays, 9 switch trays | 8 in a server |
| Scale-up link | NVLink 4, 900 GB/s per GPU | NVLink 5, 1.8 TB/s per GPU | Infinity Fabric, seven links per GPU, 128 GB/s per link |
| Host bus | PCIe Gen5, 128 GB/s | PCIe to the NIC | PCIe 5.0 x16, 128 GB/s |
| Usual RDMA NIC | ConnectX-7, 400 Gb/s, PCIe Gen5 x16 | ConnectX-7, 400 Gb/s, four per compute tray | ConnectX-7 or Pollara 400 |
[55][56][57][58][59][60][61][62][68][69]. Four cautions:
- Vendor link figures count both directions. NVIDIA calls the 1.8 TB/s “bidirectional throughput per GPU”. AMD’s 128 GB/s per link is also both directions, 64 GB/s each way. The 128 GB/s for PCIe Gen5 x16 is the same kind of sum. Halve them before comparing with a one-way benchmark.
- A benchmark never reaches the datasheet. AMD’s own measurement on MI300X shows about 48 GB/s usable on a link rated 64 GB/s one way [62]. Your baseline is a healthy twin, not the brochure.
- NVIDIA publishes no per-GPU memory figure for GB200. The 372 GB is per superchip. Dividing by two gives about 186 GB.
- Newer parts differ. MI350X and MI355X carry 288 GB. Blackwell Ultra in GB300 carries up to 288 GB. The NIC changes too: GB200 NVL72 has four ConnectX-7 in each compute tray, and GB300 NVL72 moves to ConnectX-8 at 800 Gb/s per GPU on PCIe Gen6 [61][70]. Some GB200 builds do carry ConnectX-8, so check with
lspciandethtool -ibefore you assume.
Explain it to a ten-year-old. Before you say the car is slow, you look at the speed limit sign. And you remember the sign is the limit, not the speed everyone drives.
Layer 1: PCIe and NUMA - the road everything else drives on
Every GPU and NIC hangs off PCIe. If that link is weak, everything above it is slow or gone. This is the first place I look on a slow node - before any vendor tool.
lspci -nn -d 10de:                 # NVIDIA GPUs. 1002: is AMD GPUs, 15b3: is Mellanox, 1dd8: is Pensando
sudo lspci -vv -s <bdf> | grep -E 'LnkCap|LnkSta'
lspci -tv                          # the tree: which root port owns which device
lspci -k -s <bdf>                  # which kernel driver is bound
Count the devices first. Eight GPUs installed and seven listed is the whole diagnosis: one never enumerated.
lspci needs root to show link fields [1]. The line to read is LnkSta against LnkCap. Format per the pciutils source, values made up:
LnkCap: Port #0, Speed 32GT/s, Width x16, ASPM not supported
LnkSta: Speed 8GT/s (downgraded), Width x8 (downgraded)
Two traps here, and both are easy to fall into. Since pciutils 3.8.0 a healthy link prints no tag at all, where older versions printed (ok). And the (downgraded) tag only shows on the endpoint, never on the root port above it. So read the GPU or the NIC, not the slot.
The kernel says the same thing once at boot. Look for available PCIe bandwidth, limited by in dmesg. It names the upstream device that capped the link.
Then the errors. PCIe Advanced Error Reporting, AER, logs to the kernel [2]. The wording changed around kernel 6.8, from Corrected error received to Correctable error message received. So I grep for the part that did not change:
dmesg -T | grep -E 'AER:|PCIe Bus Error'
cat /sys/bus/pci/devices/<bdf>/aer_dev_correctable
Each log line carries a severity and a layer. Together they sort the fault:
| In the log line | It means |
|---|---|
severity=Correctable, type=Physical Layer, RxErr | Bit errors, recovered. The rate is what matters |
type=Data Link Layer, BadTLP, BadDLLP, Timeout | CRC failures and replays. Marginal signal |
severity=Uncorrectable (Non-Fatal) | A transaction was lost. The driver tries to recover |
severity=Uncorrectable (Fatal) | The link is not reliable. It needs a reset |
Slot(...): Link Down | The device left the bus while running |
The sysfs file is a counter, so it is not rate limited like the log [3]. This sample is from the kernel docs, trimmed, and shows two receiver errors:
Receiver Error 2
Bad TLP 0
Bad DLLP 0
RELAY_NUM Rollover 0
Replay Timer Timeout 0
TOTAL_ERR_COR 2
The kernel documentation carries a warning that is easy to miss: a bad endpoint can show clean counters while its link partner counts the errors. Read both ends. And a silent log proves nothing on a machine where firmware keeps AER for itself. There the errors go to the BMC.
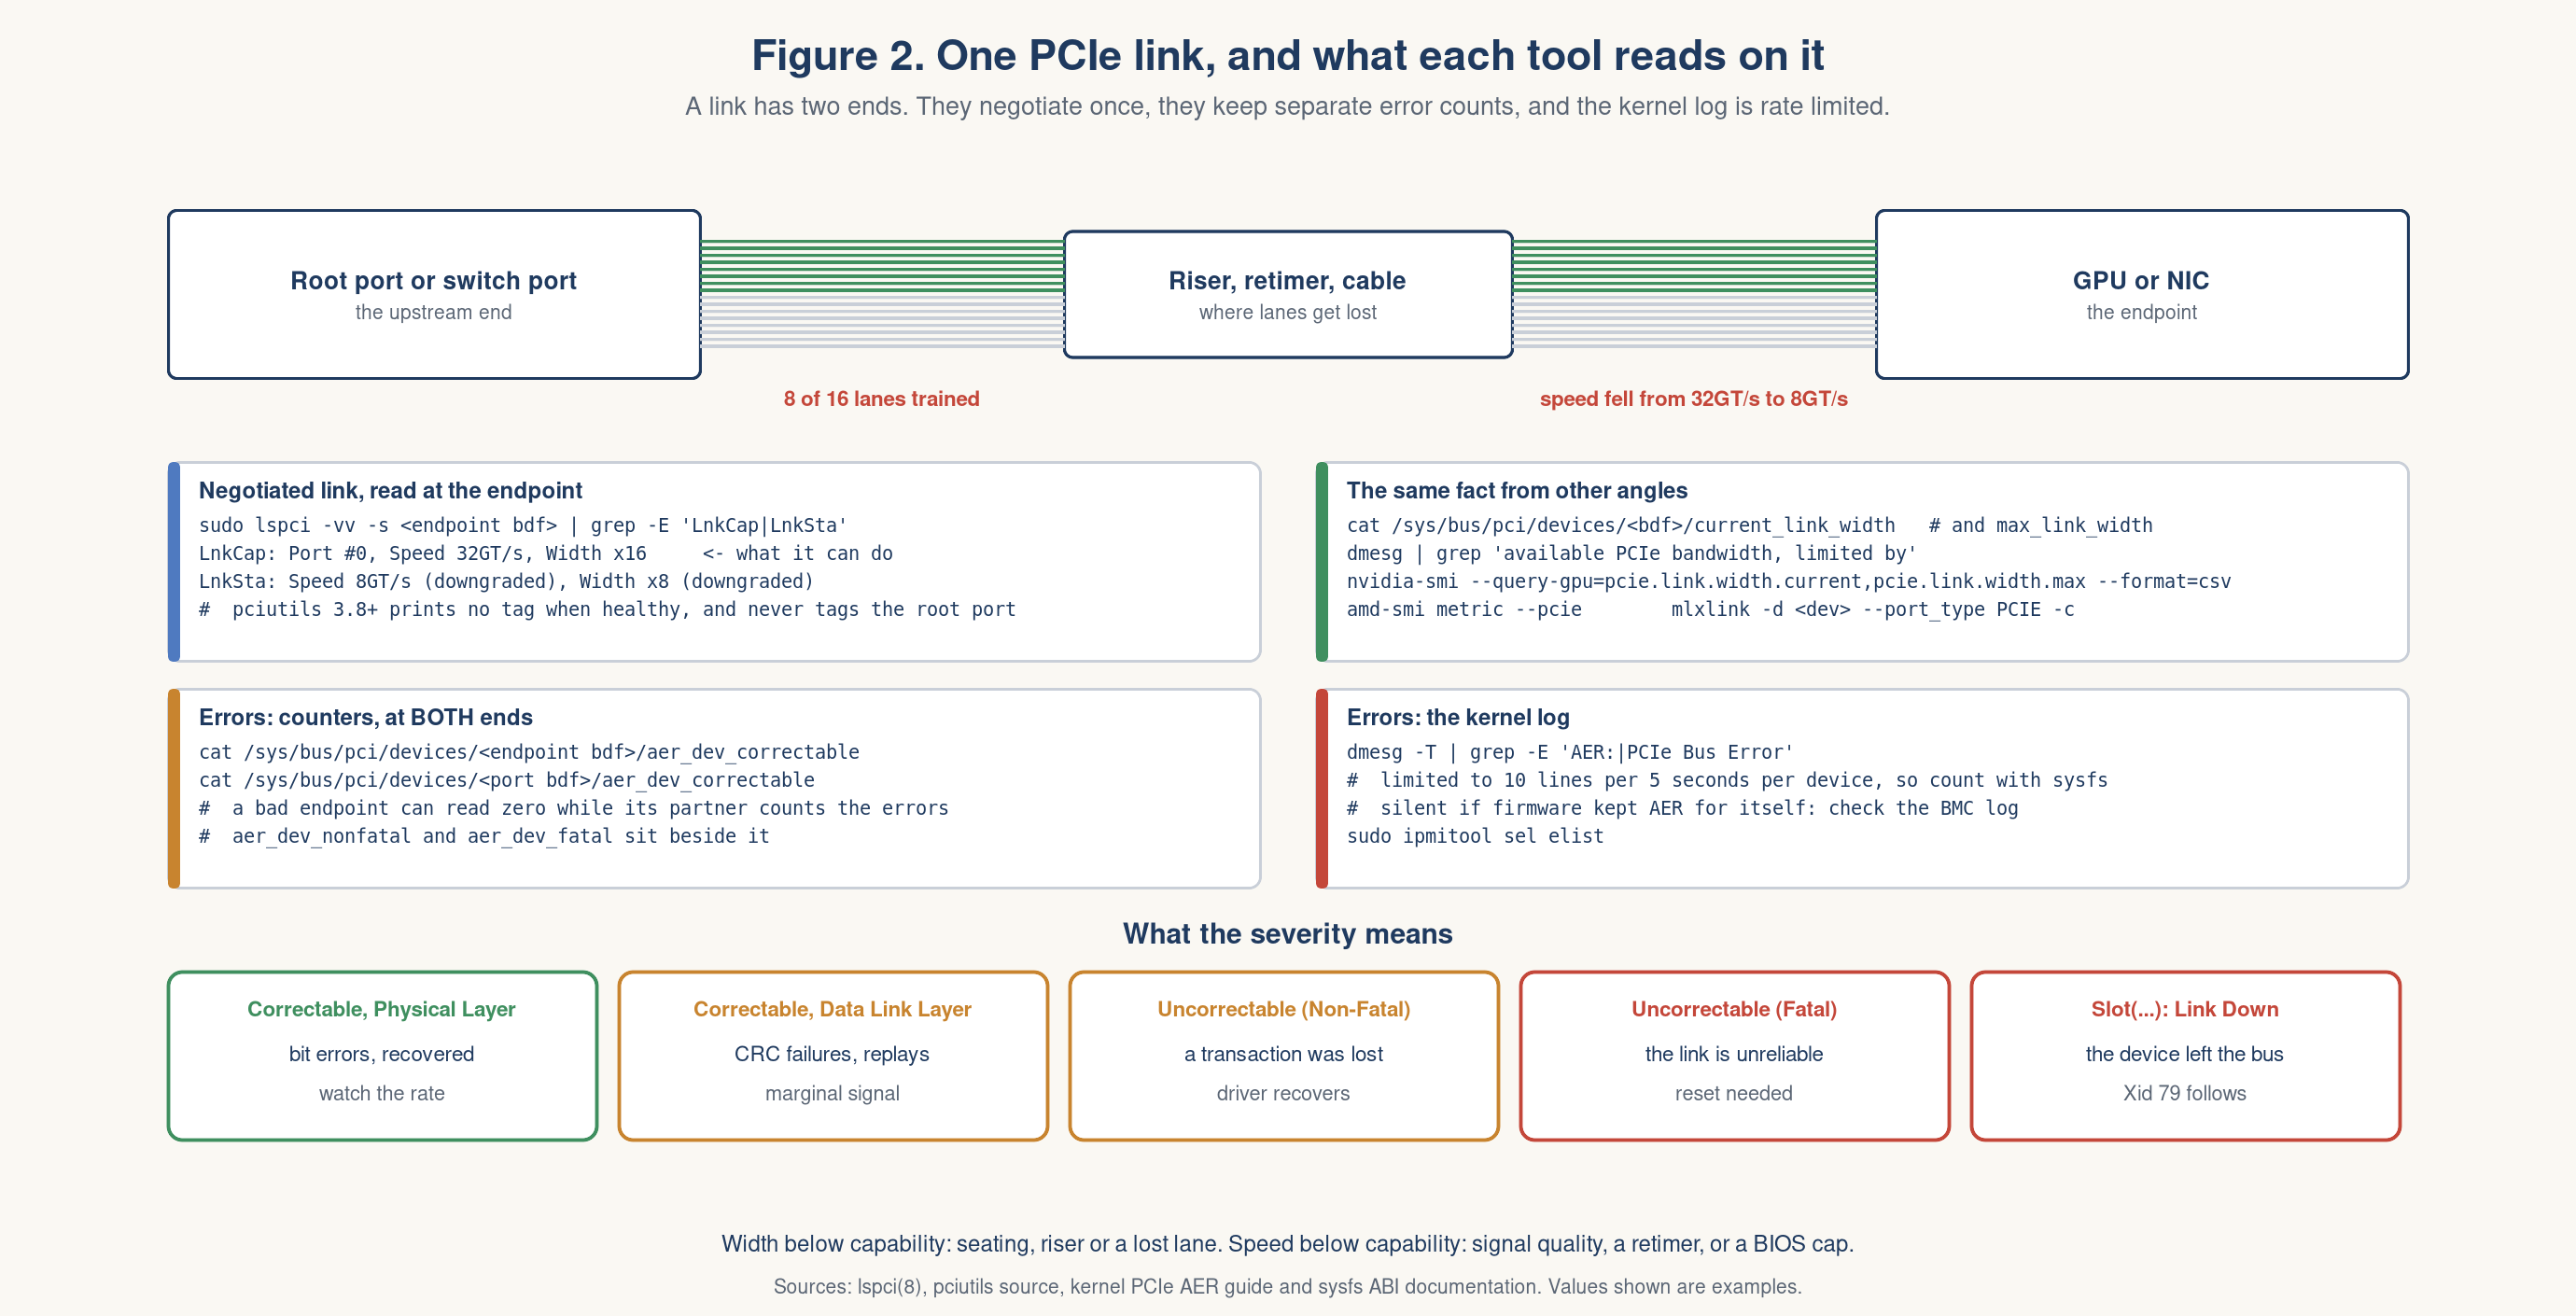
Figure 2. A link has two ends. Read the negotiated state at the endpoint and the error counters at both.
NUMA is the quiet half of this layer (no error, no log line, just a slow job). A GPU on socket 1 fed by a NIC on socket 0 throws no error. It is only slow.
numactl -H                                   # nodes, memory, distances
cat /sys/bus/pci/devices/<bdf>/numa_node     # -1 means firmware never said
lstopo-no-graphics                           # CPUs, memory and PCI devices in one tree
grep <ifname> /proc/interrupts               # where the NIC's interrupts land
numactl can bind by device, which saves the lookup: numactl --cpunodebind=netdev:eth2 --membind=netdev:eth2 <cmd> [4]. Use it as an experiment. If throughput recovers when pinned, the fault was placement. lstopo draws CPUs, memory and devices in one tree, and it is the fastest way to see a device hanging off the wrong socket [5].
Explain it to a ten-year-old. PCIe is the road from the GPU to the rest of the computer. It should have sixteen lanes. Sometimes it opens with eight and tells nobody. Nothing crashes. Everything is just late.
Layer 2: The GPU, its driver and its memory - where the two vendors part ways
This is the layer where the two vendors split, and the vocabulary splits with them. The short version I keep in my head: NVIDIA gives you a number, AMD gives you a block name.
NVIDIA speaks Xid
The driver writes a numbered error to the kernel log [7]. This line is from NVIDIA’s documentation:
NVRM: Xid (PCI:0000:5a:00): 79, GPU has fallen off the bus.
The number is the diagnosis. The ones I sort first:
| Xid | Meaning in NVIDIA’s catalog [7] | What I do |
|---|---|---|
| 13, 31, 43 | Application fault | Restart the job. Suspect hardware only if the same GPU repeats |
| 48 | Double bit ECC error | Read 63, 64, 94, 95 next to it |
| 63 / 64 | Row remap recorded / remap failed | 63: reset at next drain. 64: RMA path |
| 94 / 95 | Contained / uncontained memory error | 94: restart the app. 95: reset the GPU |
| 79 | GPU fell off the bus | Go back to Layer 1. Check the slot and the BMC log |
| 119 / 120 | GSP firmware timeout or error | Reset, then report if it returns |
| 74 | NVLink error, A100 and H100 | Go to Layer 3 |
| 144 to 150 | NVLink 5 errors, Blackwell. 149 is the link itself | Decode it, then Layer 3 |
| 154 | Recovery action changed | Do what it says |
| 171 / 172 | The Xid 48 was in DRAM / in SRAM | Tells you which memory failed |
Memory errors arrive as a group, and the group tells one story. Xid 48 says an uncorrectable error was found. Then 94 says it was contained to one application, or 95 says it was not. Then 63 says a repair is queued, or 64 says the repair could not be recorded. Xid 45 trails behind as the driver cleans up. Read the set, not the single line.
Xid 154 matters more than it looks (do not skip it). Newer drivers tell you the fix. nvidia-smi -q shows it as GPU Recovery Action, with values such as None, Reset, Reboot, and Drain and Reset [6].
When there is no Xid, the exit code of plain nvidia-smi still talks. 15 means a GPU fell off the bus. 9 means the driver is not loaded. 14 means a corrupt infoROM [6].
For memory and link state, two commands cover it:
nvidia-smi -q -d ECC,ROW_REMAPPER
nvidia-smi --query-gpu=index,pci.bus_id,pcie.link.width.current,pcie.link.width.max,remapped_rows.pending,remapped_rows.failure,gpu_recovery_action --format=csv
Field labels per NVIDIA’s docs, values made up:
Remapped Rows
    Correctable Error                 : 0
    Uncorrectable Error               : 2
    Pending                           : Yes
    Remapping Failure Occurred        : No
Pending : Yes means a repair waits for the next GPU reset. The job can keep running. Remapping Failure Occurred : Yes is the flag NVIDIA’s RMA policy keys on [8]. A GPU can remap up to 512 rows, against 64 retired pages on older parts, so one remap is routine and not a reason to pull a card.
One habit protects the evidence, and it ties back to step 4 of the method. Volatile ECC counts reset when the driver unloads, which happens whenever the last client exits. Running nvidia-persistenced keeps them alive between jobs.
DCGM adds history and active tests. dcgmi health -c reports what its background watches saw. This sample is from NVIDIA’s docs, trimmed:
| GPU ID: 0        | Warning                                                 |
|                  | PCIe system: Warning - Detected more than 8 PCIe        |
|                  | replays per minute for GPU 0: 13                        |
That is a Layer 1 fault reported at Layer 2. For active tests, the levels and their documented runtimes on Hopper systems [9]:
| Level | Adds | 4 GPU / 8 GPU |
|---|---|---|
dcgmi diag -r 1 | software checks, pending remaps | under 2.5 seconds |
-r 2 | PCIe, NVLink, memory | under 2.5 min / 10.5 min |
-r 3 | stress, power, bandwidth | under 10 min / 35 min |
-r 4 | memtest, pulse | under 45 min / 2.25 hours |
Level 1 is cheap enough for a job prolog. NVIDIA notes these are online tests, and that an RMA needs its separate offline diagnostics.
One warning for dashboards. DCGM 4.6 renamed many fields, so DCGM_FI_DEV_XID_ERRORS is now DCGM_FI_DEV_XID_ERROR. The numeric IDs did not move. dcgmi dmon -e 230,202,311,393,395,396 still works: last Xid, PCIe replays, double bit errors, remapped rows, remap failed, remap pending.
AMD speaks RAS
There is no single number in the log. The amdgpu driver counts errors per hardware block, and amd-smi reads them [10][11]:
amd-smi metric --ecc --ecc-blocks     # error counts per hardware block
amd-smi bad-pages                     # retired, pending and unreservable pages
amd-smi metric --pcie                 # speed, width, replay count
amd-smi static --ras                  # which blocks have RAS switched on
Healthy output, from AMD’s docs:
ECC:
    TOTAL_CORRECTABLE_COUNT: 0
    TOTAL_UNCORRECTABLE_COUNT: 0
    TOTAL_DEFERRED_COUNT: 0
ECC_BLOCKS:
    UMC:
        CORRECTABLE_COUNT: 0
        UNCORRECTABLE_COUNT: 0
        DEFERRED_COUNT: 0
The block name is the diagnosis:
| Block | What it is | Go to |
|---|---|---|
UMC | HBM memory controller | amd-smi bad-pages |
XGMI_WAFL | GPU to GPU link | Layer 3 |
PCIE_BIF | Link to the host | Layer 1 |
GFX, SDMA, MMHUB | Compute engine, copy engine, memory hub | AMD support, with the CPER |
AMD has a third error class that NVIDIA does not name: deferred. The error is known and flagged, and it has not been consumed yet.
Bad pages are AMD’s version of row remapping. The kernel exposes the list with one flag per page [11]. R is retired. P is pending. F could not be reserved, and that is the one to escalate. In dmesg the driver warns as the table fills, with RAS records and exceeds 90% of threshold, and at the limit it tells you to consult the AMD Service Action Guide.
The nearest thing to an Xid is the AFID, the AMD Field ID. You get one by decoding the error record the firmware wrote [10][12]. From AMD’s docs, trimmed:
$ sudo amd-smi ras --cper --severity all --folder /tmp/cper_dump/
timestamp            gpu_id  severity   file_name       list of afids
2000/06/27 10:45:13  0       FATAL      fatal-1.cper    30
Look the number up in AMD’s AFID guide [12]. A few rows from it:
| AFID | Category | Type | Severity |
|---|---|---|---|
| 18 | Off-Package Link Errors | XGMI | Fatal |
| 19 | HBM Errors | Bad Page Retirement Threshold | Fatal |
| 22 | HBM Errors | On-die ECC | Uncorrected, Non-fatal |
| 30 | Device Internal Errors | All Others | Fatal |
The guide gives category and severity. It does not give the fix, which stays with your service provider. In my opinion, that is the real gap against Xid, where the catalog names an action.
For an active test AMD ships the ROCm Validation Suite [14]. rvs -g lists the GPUs it can see. rvs -c <conf> runs one module, and rvs -r 1 to -r 5 runs a stress level. The modules worth knowing are gst for compute stress, mem for HBM patterns, pebb for host to GPU bandwidth, and pbqt for GPU to GPU. The names in older blogs are stale: gm and pesm are deprecated, and the PCIe module is peqt. rocm-smi is in maintenance mode too. Use amd-smi.
The partition trap. An MI300X can present itself to the OS as one GPU or as several. This is a setting, not a fault, and it catches people on shared clusters [53][54].
amd-smi partition --current           # compute and memory partition mode per GPU
amd-smi partition --memory            # memory partition detail
amd-smi partition --accelerator       # the compute modes this GPU accepts
| Compute mode | What the OS sees per MI300X | On an 8-GPU node |
|---|---|---|
| SPX | 1 GPU, 304 compute units, 192 GB | 8 devices |
| DPX | 2 GPUs, 152 compute units and 96 GB each | 16 devices |
| CPX | 8 GPUs, 38 compute units and 24 GB each | 64 devices |
If a node shows 64 devices of 24 GB, it is in CPX mode. A job that asks for “one GPU” there gets one eighth of a module, and runs at one eighth of the speed with no error anywhere. Memory has its own setting, NPS1, NPS2 or NPS4 on MI300X, and only some pairs are valid: NPS2 needs DPX, and NPS4 needs CPX.
Changing it is sudo amd-smi set --gpu all --compute-partition SPX. A memory mode change needs every GPU process stopped and the driver reloaded. The compute mode goes back to SPX on reboot or driver reload, so a node can change shape between two jobs.
One more check with no NVIDIA twin. rocminfo asks the compute runtime, not the driver, what it can open. If amd-smi list shows eight GPUs and rocminfo shows seven agents, the driver is fine and the runtime is not.
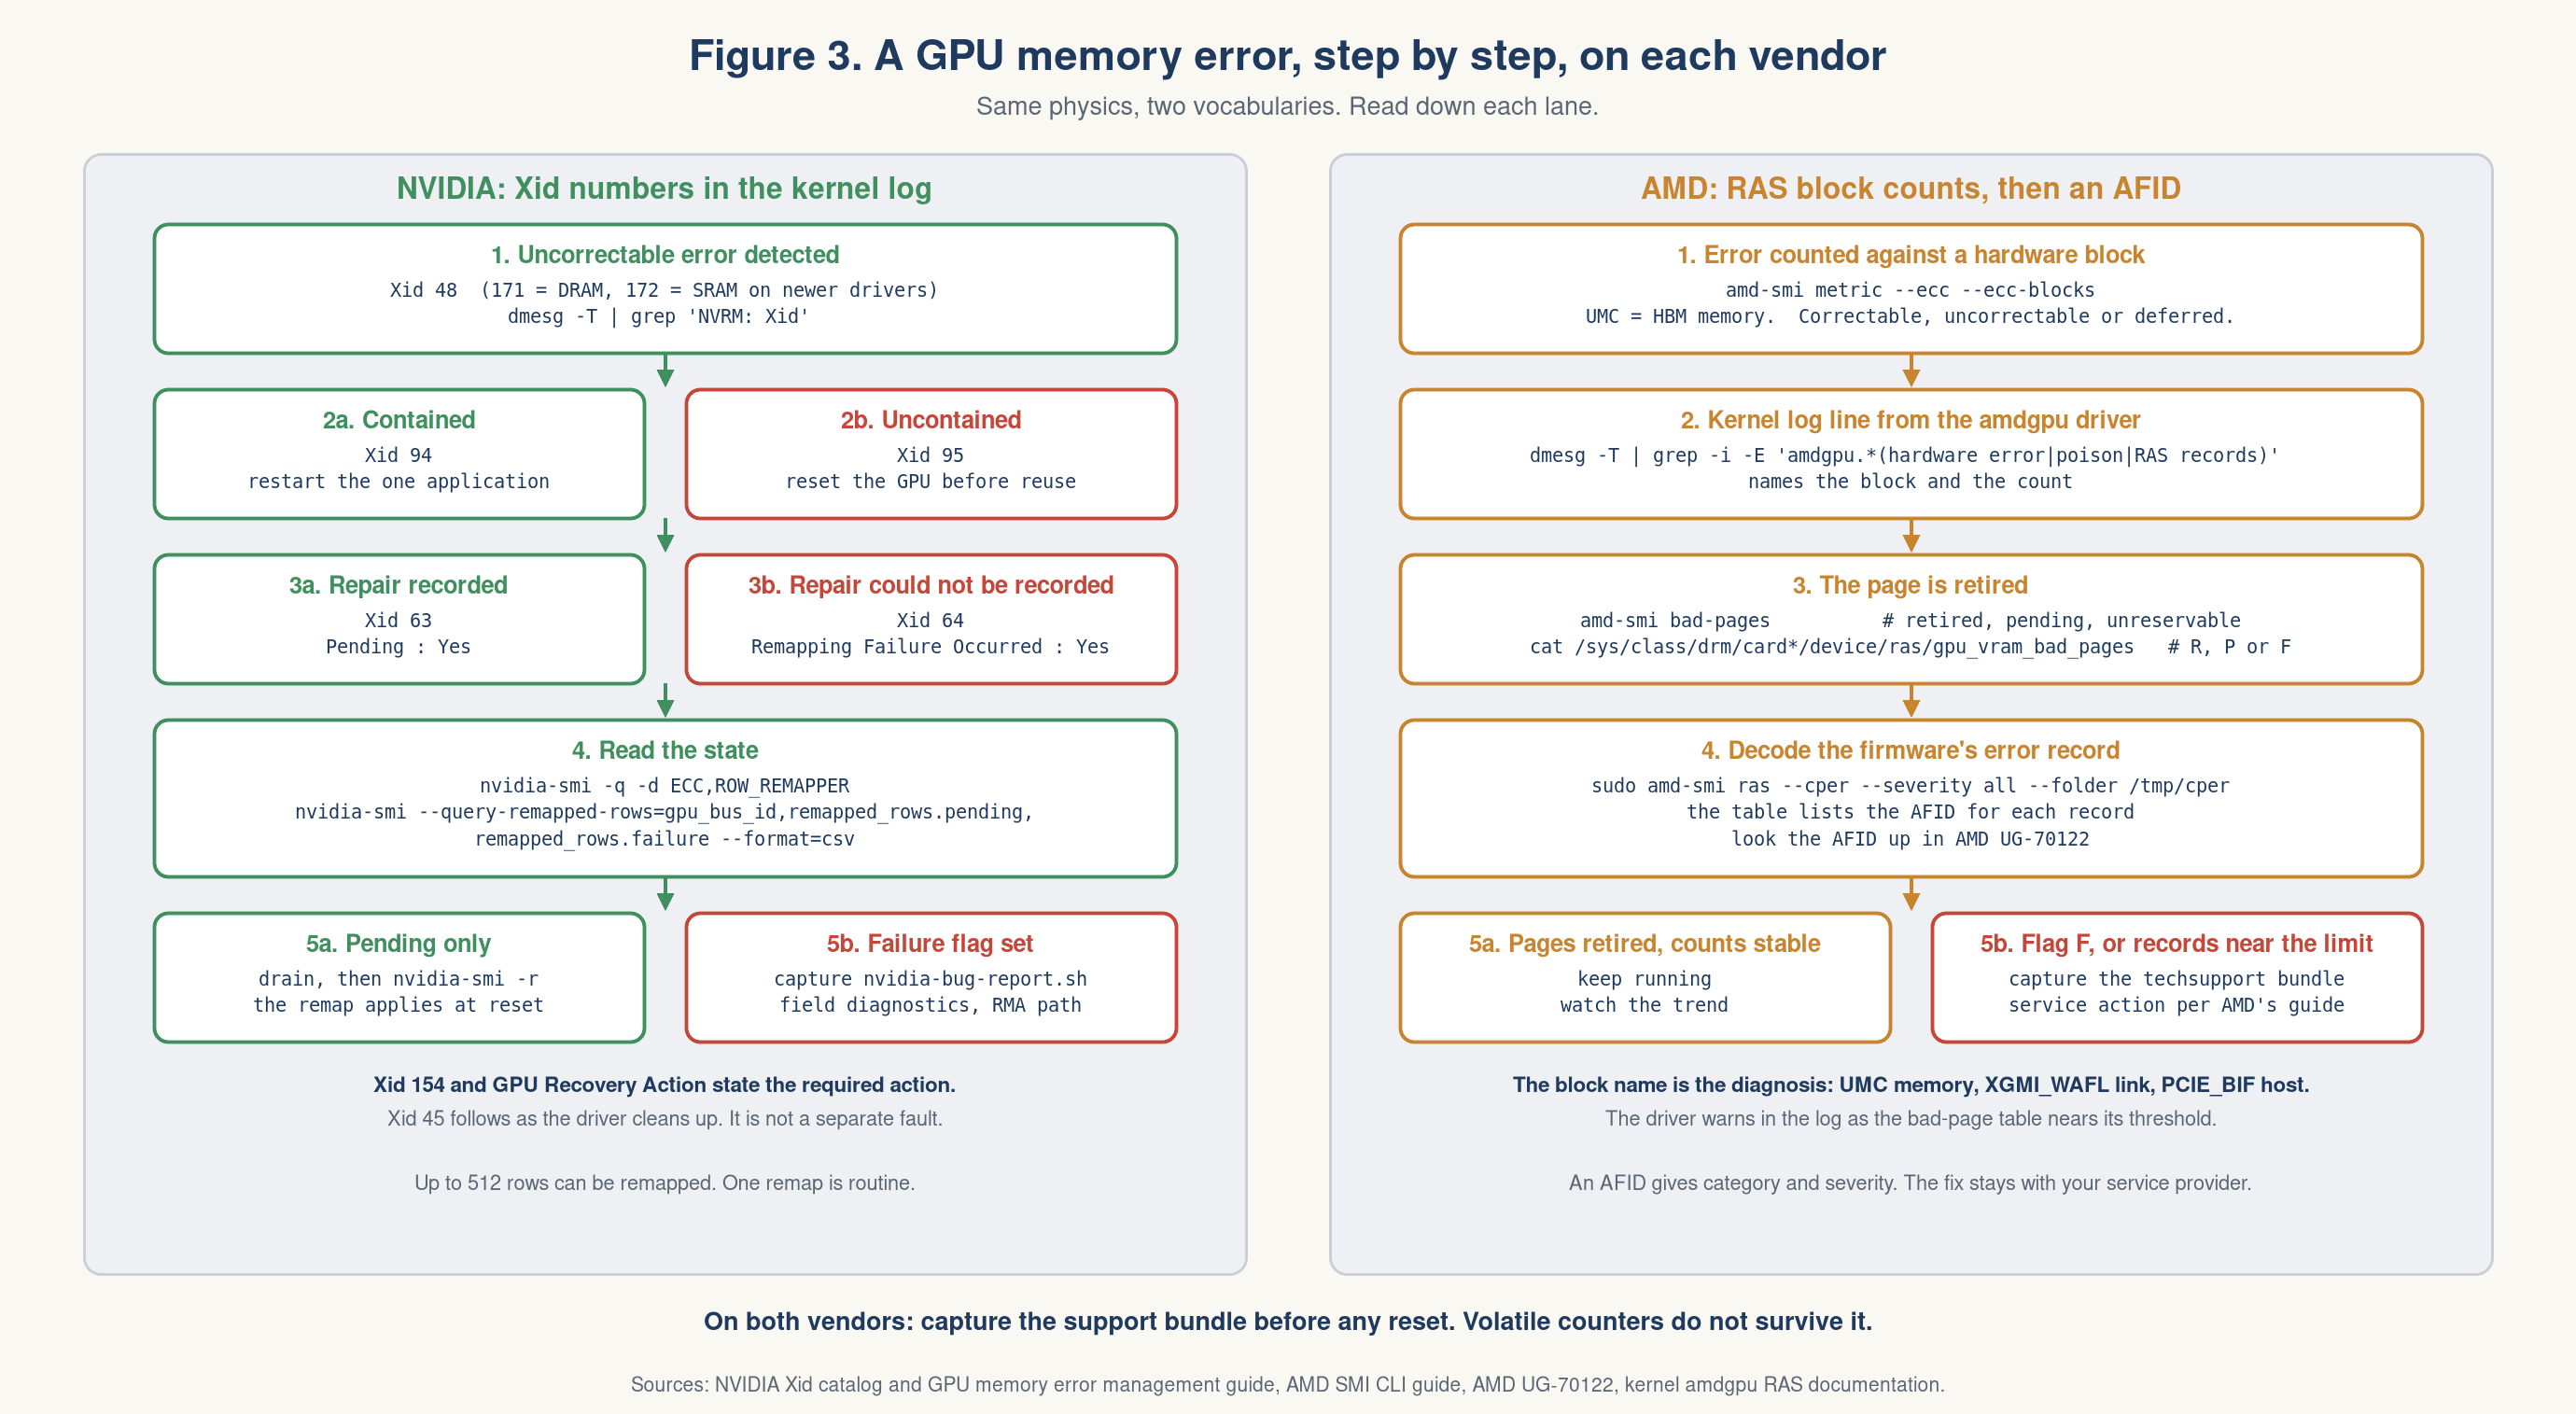
Figure 3. The same memory fault, followed down each vendor’s lane.
Explain it to a ten-year-old. NVIDIA’s GPU shouts a number when it is hurt, like “79!”, and there is a book that says what each number means. AMD’s GPU keeps a tally chart for each part of its body. You read the chart to see which part hurts.
Layer 3: The scale-up fabric - how the GPUs inside one node talk
Inside a node, GPUs talk over their own links. NVLink on NVIDIA. Infinity Fabric, shown by the tools as xGMI, on AMD.
nvidia-smi nvlink -s          # each link: bandwidth if Active, else Inactive or Sleep
nvidia-smi nvlink -e          # error counters
nvidia-smi topo -m            # who reaches whom, and how
amd-smi xgmi -l               # U up, D down, X disabled, per link
amd-smi xgmi -m               # bit rate and traffic per peer
amd-smi topology -o -t        # hops and link type per GPU pair
Two things changed recently, and old runbooks miss both (check yours).
NVLink 5 has new counters. Blackwell dropped the vocabulary most of us learned [6]:
| NVLink 4 (Hopper and older) | NVLink 5 (Blackwell) |
|---|---|
| Replay Errors | Link recovery successful / failed events |
| Recovery Errors | Effective Errors, Effective BER |
| CRC Errors | Symbol Errors, Symbol BER, FEC histogram |
On NVLink 5 the line that matters is failed link recoveries. A link that recovers is tired. A link that fails recovery is down.
On AMD, hops settles the argument. The value in amd-smi topology -o is a class, not a count [10]:
| Hops | The pair talks over |
|---|---|
| 1 | xGMI |
| 2 | PCIe, same NUMA node |
| 3 | PCIe, across NUMA nodes |
AMD’s reference MI300X platform is a full mesh of seven links per GPU [13], so I expect ones everywhere. A two is a finding. The link view shows it plainly. This sample is from AMD’s docs, and it shows a degraded system:
XGMI LINK STATUS:
GPU0   0000:08:00.0  U  U  U  U  D  U  D  X
GPU1   0000:44:00.0  U  U  U  U  D  U  D  X
One trap on the AMD side. The xGMI error value is “since last read”. Reading it clears it. If a monitoring agent polls it every minute, a human who looks later sees zero.
nvidia-smi topo -m also bridges to Layer 1. Its legend, closest to farthest [6]:
| Value | The path between the two devices |
|---|---|
NV# | A bonded set of NVLinks |
PIX | One PCIe switch |
PXB | Several PCIe switches, no host bridge |
PHB | A PCIe host bridge, usually the CPU |
NODE | Host bridges inside one NUMA node |
SYS | Across NUMA nodes |
For GPUDirect traffic I want PIX or PXB between a GPU and its NIC. SYS is a slow node waiting to be noticed.
Explain it to a ten-year-old. The GPUs in one box have private hallways between their rooms. If one hallway is blocked, they can still shout through the front door, but it takes much longer.
The GPUDirect path: GPU memory straight to the wire
Layers 3 and 4 meet here - this is the path that makes RDMA worth having on a GPU node. In a healthy node the NIC reads and writes GPU memory directly. The data never lands in host memory and the CPU never touches it. When that path quietly falls back, everything still works and everything is slow.
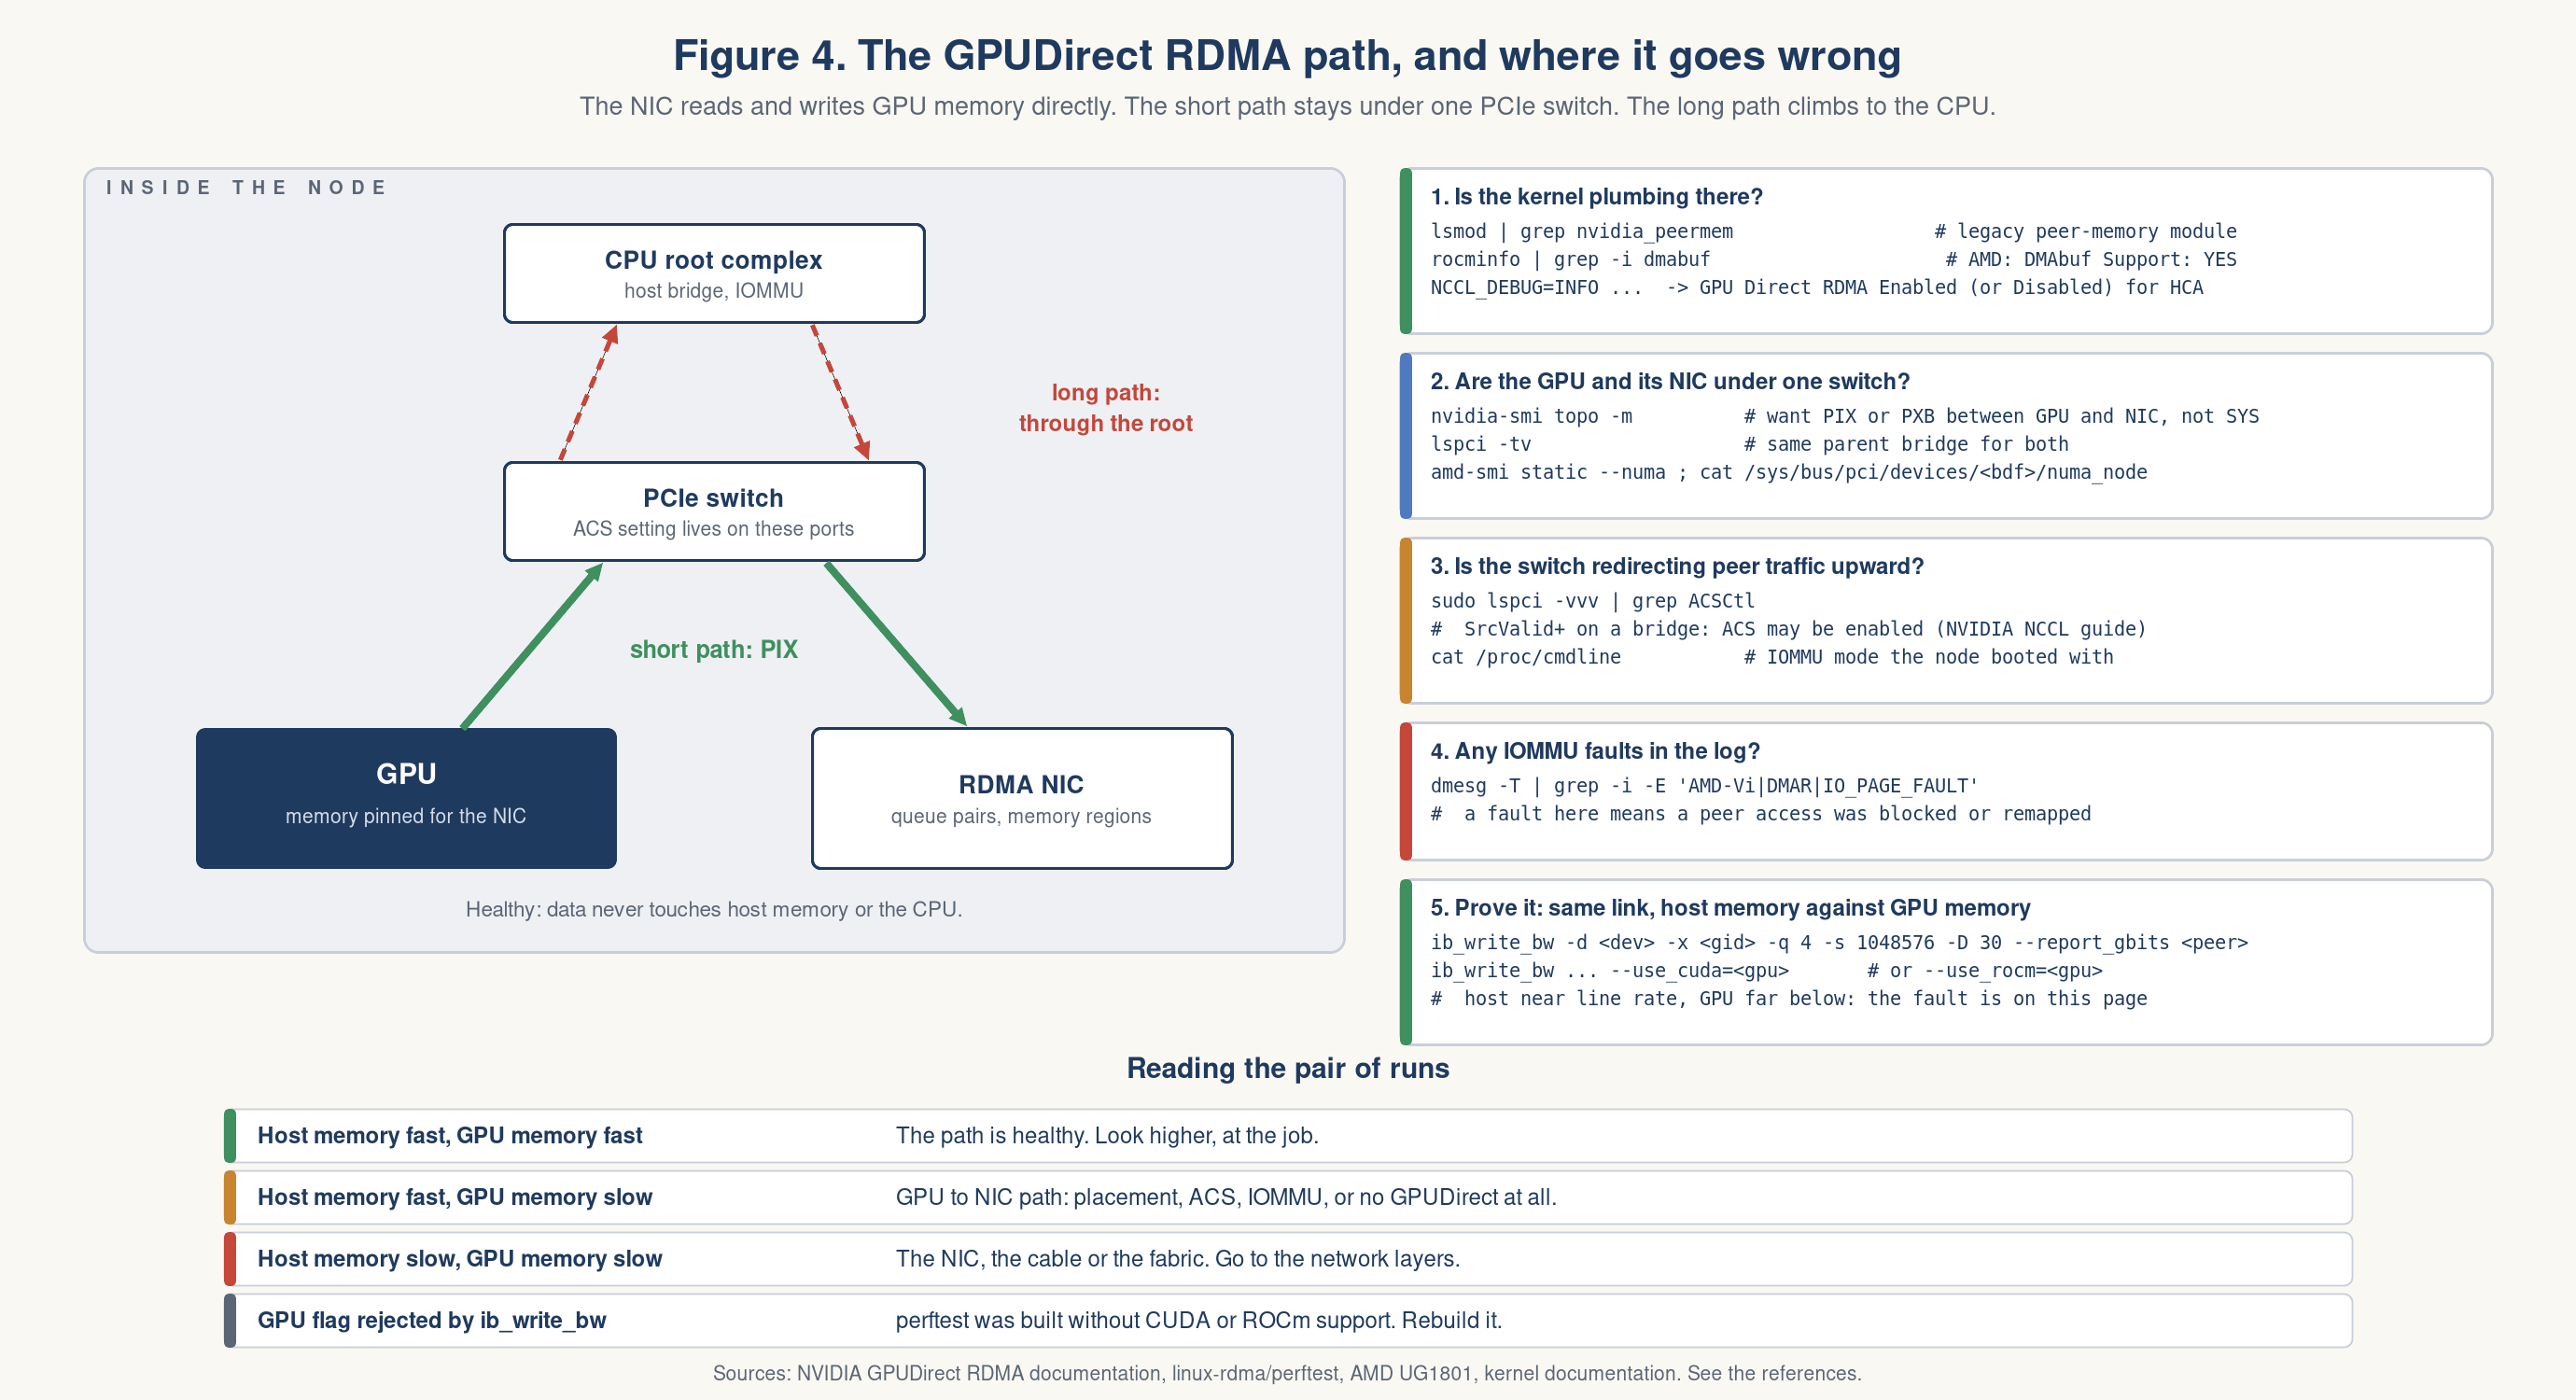
Figure 4. The short path stays under one PCIe switch. The checks on the right run in order.
How it works, in three steps. The application asks the GPU driver to pin a region of GPU memory. The driver hands the NIC the addresses of those pages, either through the older nvidia-peermem module or through the kernel’s dma-buf interface. From then on the NIC moves data to and from those pages over PCIe by itself.
That last step has one hard requirement, and NVIDIA states it: GPUDirect RDMA “relies upon all physical addresses being the same from the different PCI devices’ point of view”, which makes it “incompatible with IOMMUs performing any form of translation other than 1:1, hence they must be disabled or configured for pass-through translation” [49]. Two settings can break that, and neither raises an error.
Is the kernel plumbing there?
lsmod | grep nvidia_peermem          # the legacy peer-memory module, if your stack uses it
cat /proc/cmdline                    # how the IOMMU was set at boot
[51]. The right IOMMU setting depends on the platform. NVIDIA documents iommu=pt for some DGX systems, intel_iommu=off for older ones, and a different arrangement again on Grace-based systems [52]. My advice: do not copy a setting from another machine. Compare against the vendor guide for yours, and against a healthy twin.
Is a PCIe switch sending peer traffic the long way round? Access Control Services, ACS, is a PCIe feature that can force traffic between two devices under one switch to go up to the root and back. NVIDIA’s NCCL guide gives the check:
sudo lspci -vvv | grep ACSCtl # "SrcValid+" on a bridge means ACS may be enabled
“If lines show SrcValid+, then ACS might be enabled” [50]. The same page gives the fix for bare metal: disable I/O virtualization in the BIOS, or clear it per bridge with sudo setpci -s <bridge bdf> ECAP_ACS+0x6.w=0000, which must be repeated after each reboot. On a virtualized host ACS is there for isolation, so that fix belongs to the platform owner, not to you.
Is the IOMMU blocking a peer access? It says so in the kernel log:
dmesg -T | grep -E 'AMD-Vi: Event logged \[IO_PAGE_FAULT|DMAR: \[DMA'
Did NCCL engage it? With NCCL_DEBUG=INFO, NCCL prints one line per NIC: GPU Direct RDMA Enabled for HCA or GPU Direct RDMA Disabled for HCA. Disabled, with no other error, is the whole finding.
Is the GPU close to its NIC? nvidia-smi topo -m gives the distance. NCCL uses the same scale to decide whether to use GPUDirect at all: NCCL_NET_GDR_LEVEL sets the farthest distance it will accept, from LOC through PIX, PXB and PHB to SYS [33]. A GPU and NIC at SYS may be skipped without any error.
Prove it with two runs. This is the test I trust most, because it needs no interpretation. Run ib_write_bw on host memory, then the same command on GPU memory, and compare [21]:
ib_write_bw -d <dev> -x <gid> -q 4 -s 1048576 -D 30 --report_gbits <peer>                  # host memory
ib_write_bw -d <dev> -x <gid> -q 4 -s 1048576 -D 30 --report_gbits --use_cuda=<gpu> <peer>  # NVIDIA GPU memory
ib_write_bw -d <dev> -x <gid> -q 4 -s 1048576 -D 30 --report_gbits --use_rocm=<gpu> <peer>  # AMD GPU memory
Add --use_cuda_dmabuf or --use_rocm_dmabuf to test the dma-buf path specifically. The perftest README states what that needs on NVIDIA: CUDA Toolkit 11.7 or later and the open-source GPU kernel modules, version 515 or later [21].
| Host memory run | GPU memory run | Where the fault is |
|---|---|---|
| Near line rate | Near line rate | Nowhere on this path. Look at the job |
| Near line rate | Far below | Between the GPU and the NIC: placement, the PCIe path, or GPUDirect not engaged |
| Far below | Far below | The NIC, the cable or the fabric. Go to Layers 4 and 5 |
| Runs | Flag rejected | perftest was built without GPU support. Check ib_write_bw -h | grep -i -E 'cuda|rocm' |
On AMD the mechanism is the kernel’s dma-buf. rocminfo reports whether the runtime supports it, as DMAbuf Support: YES. AMD’s Pollara guide documents both routes for RCCL: a peer-memory module by default, and dma-buf when NCCL_DMABUF_ENABLE=1 is set [22].
Explain it to a ten-year-old. The delivery van can drive straight into the warehouse and unload at the shelf. If the side door is locked, it parks out front and someone carries every box through the office. The boxes still arrive. It just takes all day.
Layer 4: The NIC and RDMA - what the network card counted
Between nodes the traffic is RDMA. I always start vendor neutral. These work on a ConnectX and on an AMD Pollara alike, because both speak standard verbs [15][16]:
rdma link show                 # state ACTIVE, physical_state LINK_UP, and the netdev
ibv_devinfo -d <dev>           # state, active_mtu, link_layer
rdma resource show             # QP count. Zero during a job means it fell back to TCP
ethtool -i <if>                # driver, firmware version, PCI address
ethtool -S <if> | grep -E 'prio[0-7]_pause|discards|out_of_buffer'
Port state has two halves, and the pair is the diagnosis. ibstat prints them as State and Physical state:
| State | Physical state | It means |
|---|---|---|
| Active | LinkUp | Healthy |
| Down | Polling | Trying to train, no partner. Cable, optic or the far port |
| Down | Disabled | Switched off, by an admin or by firmware |
| Initializing | LinkUp | InfiniBand only. The cable is fine. No subnet manager has claimed the port |
On RoCE, check active_mtu. It follows the netdev MTU: a 1500 byte netdev gives 1024, a 9000 byte one gives 4096. A mismatch stalls large messages and passes small ones, which makes it look like an application bug.
Check the address table too. RoCE v2 needs an IP on the port, and the job must use a GID index whose type is v2. show_gids prints the table. No IP means no v2 entry, and the connection never forms.
For RoCE the counters tell a story in three parts [17][23]:
| Counter | Where | It means |
|---|---|---|
rx_prio3_pause rising | ethtool -S | The switch is pausing this host. Congestion is downstream |
tx_prio3_pause rising | ethtool -S | This host cannot drain. It is the slow one |
rx_discards_phy rising | ethtool -S | Drops on a port that should be lossless. PFC is not protecting it |
tx_pause_storm_error_events | ethtool -S | A pause storm. The NIC gave up and stopped pausing |
np_cnp_sent, rp_cnp_handled | hw_counters | ECN congestion control is working |
out_of_sequence, local_ack_timeout_err | hw_counters | Packets are really being lost |
rnr_nak_retry_err, out_of_buffer | hw_counters | The receiver is not ready. Software, not the wire |
Priority 3 is the usual lossless class. Substitute yours. The hardware counters live under /sys/class/infiniband/<dev>/ports/1/hw_counters/ or come from rdma statistic show.
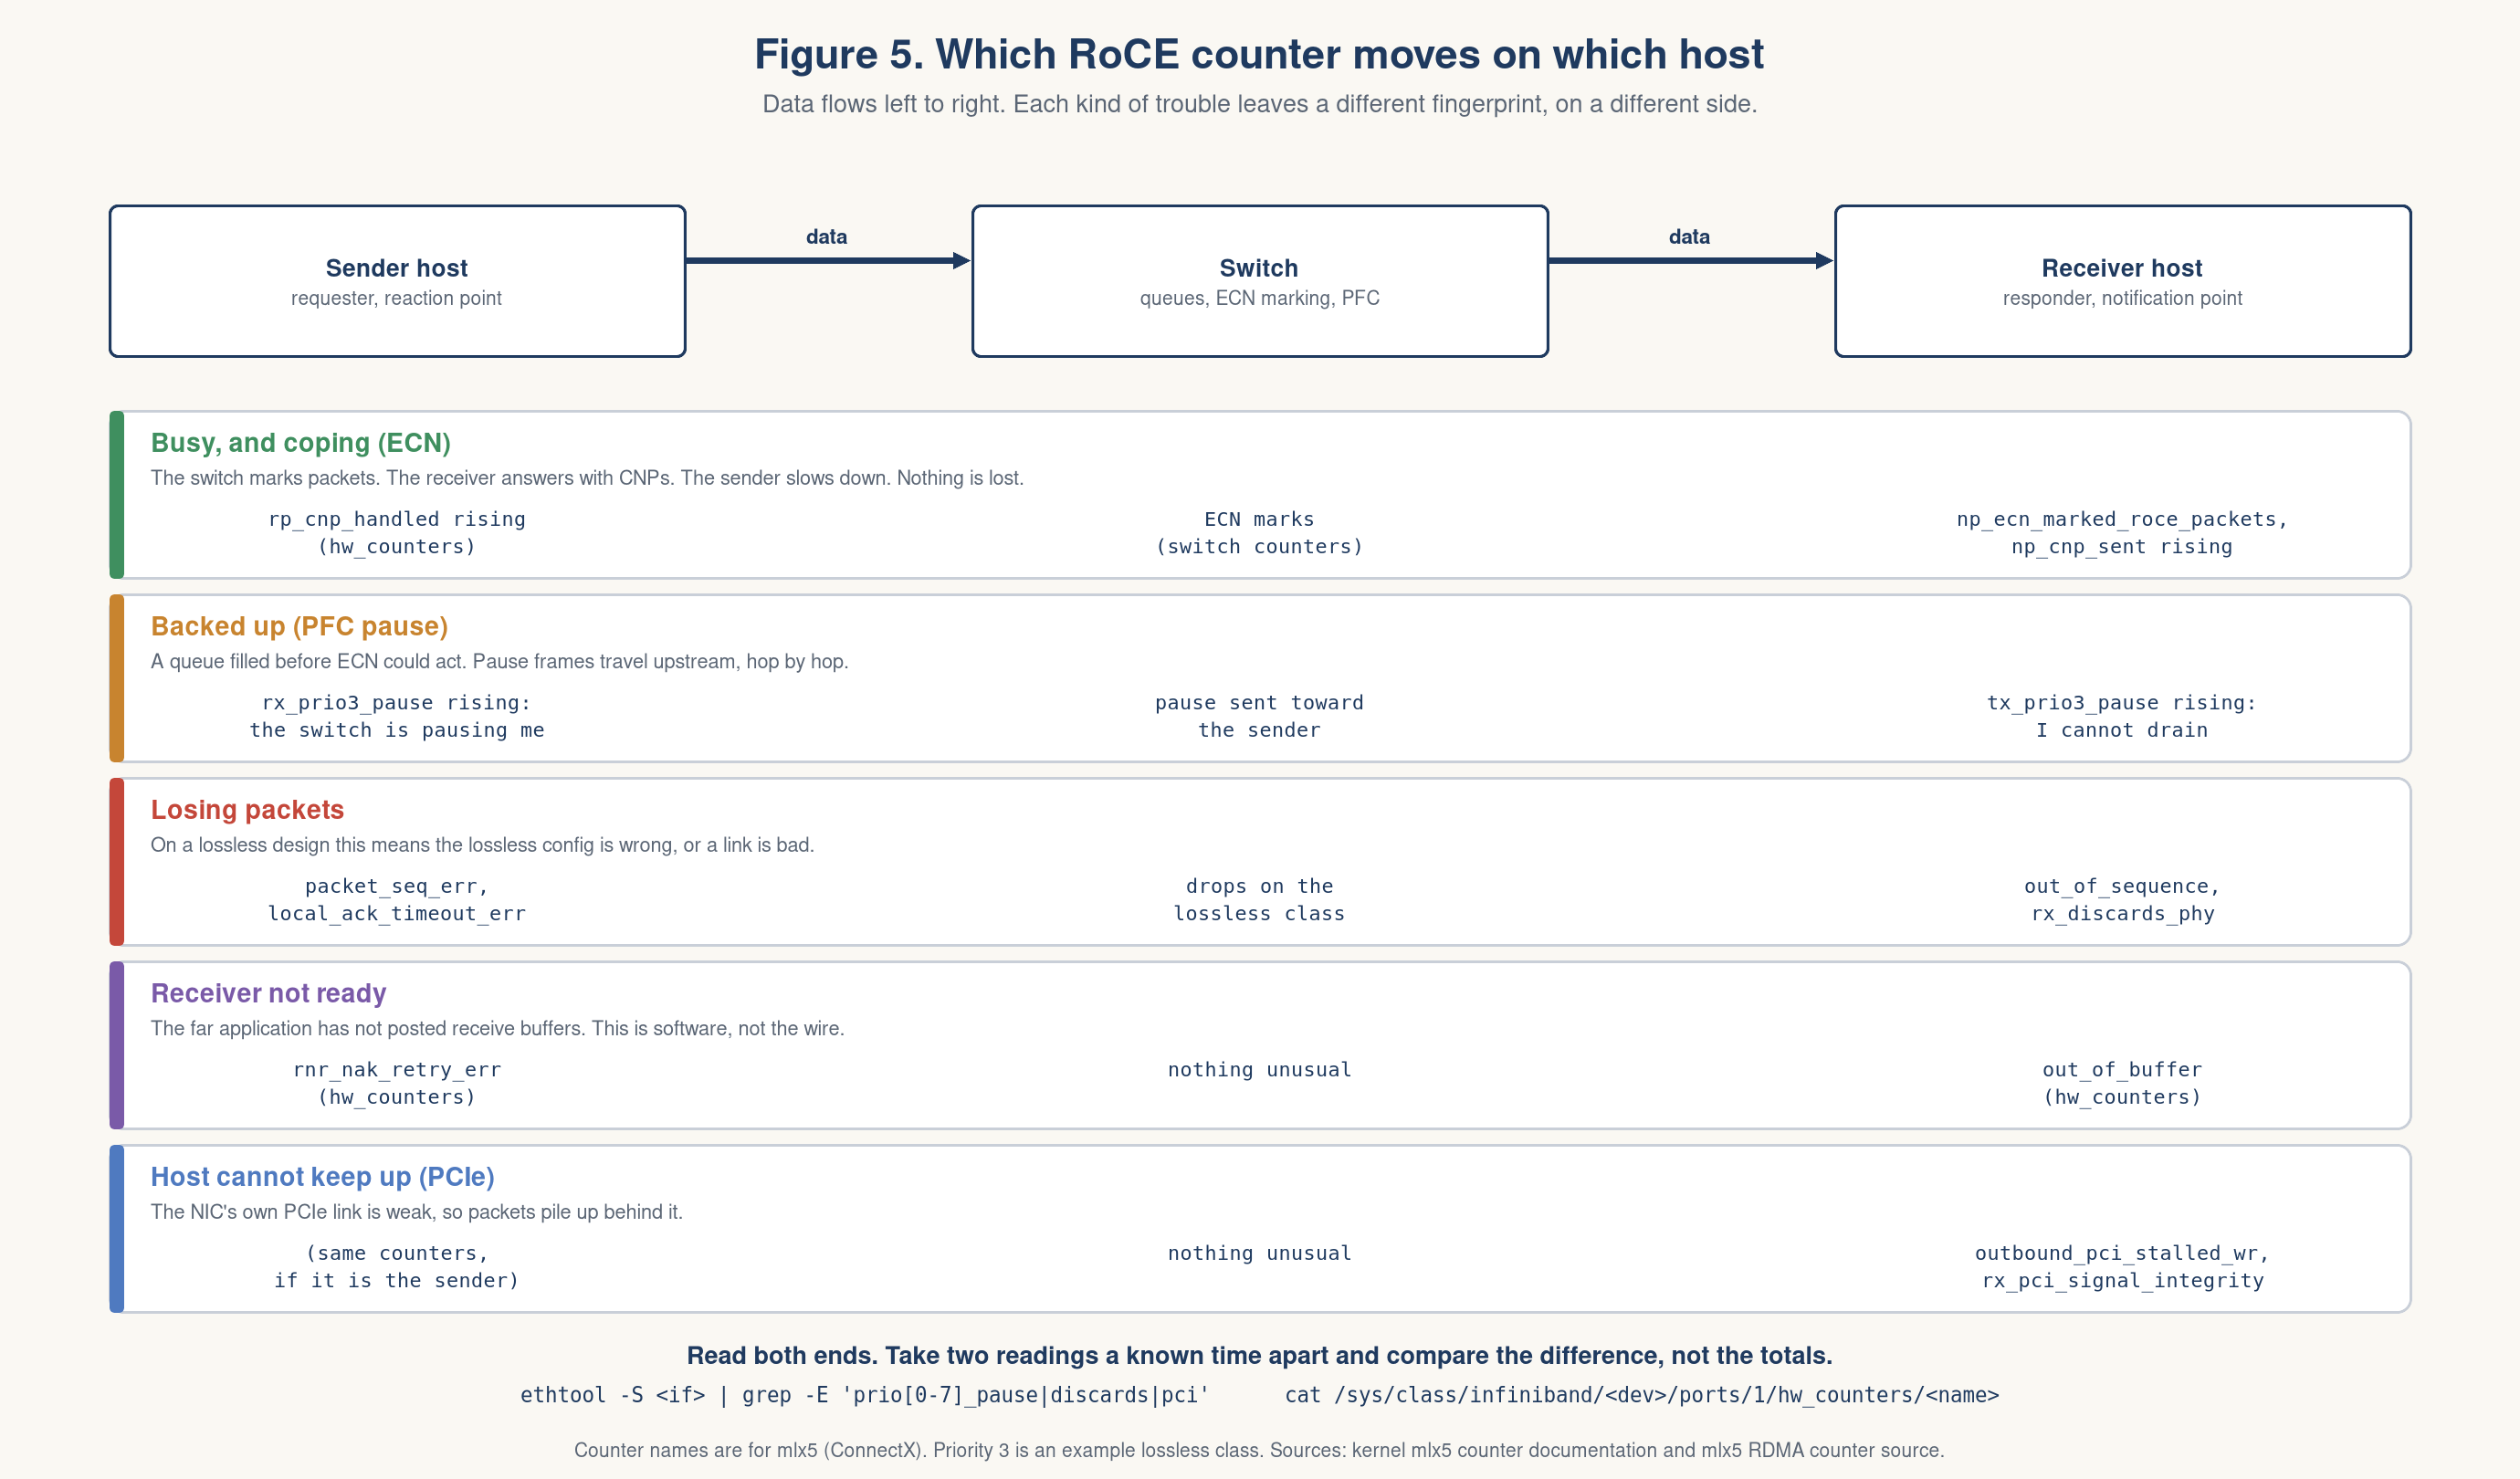
Figure 5. Each kind of trouble moves a different counter, on a different side of the link.
Read them in order (the order matters). Congestion marks with no sequence errors mean the fabric is busy and coping. Sequence errors and timeouts mean packets are being lost, and on a lossless design that means the lossless config is wrong somewhere. Receiver-not-ready counts point at the application on the far side.
One counter ties this layer back to Layer 1. rx_pci_signal_integrity is the NIC’s own view of its PCIe link. If it climbs, the kernel doc’s advice is a different slot and newer firmware.
Then the vendor tools. On ConnectX, mlnx_qos -i <if> prints trust mode and the PFC vector [24]. This is what priority 3 lossless looks like, in the format NVIDIA documents:
Priority trust state: dscp
PFC configuration:
        priority 0 1 2 3 4 5 6 7
        enabled 0 0 0 1 0 0 0 0
All zeros on that last line is the fault. Trust and PFC do not persist across boots, so “it worked yesterday” is a real failure mode. mlxconfig -d <dev> q shows firmware settings and mlxfwmanager --query shows firmware versions. A replaced card with factory defaults is the usual drift.
On Pollara the tool is nicctl, and AMD documents it per command [22]:
nicctl show card --detail                  # firmware, partition, reset reason
nicctl show port                           # link state, FEC, link-down count, transceiver
nicctl show port statistics                # MAC, pause and FEC counters
nicctl show qos pfc                        # no-drop priorities
nicctl show dcqcn                          # congestion control profile
nicctl show rdma queue-pair statistics     # ACK timeouts, RNR, ECN and CNP per queue pair
Three Pollara facts from AMD’s guide are worth knowing before an incident, because each is a quiet default [22]:
- DCQCN is off by default. AMD states it plainly: “DCQCN is disabled by default on the AI NIC.” It is switched on with
nicctl update dcqcn --profile-id 1 ..., and the setting “must be reapplied after the host is rebooted”. Sonicctl show dcqcnshowingStatus : Disabledafter a reboot is the first thing to rule out on a congested Pollara fabric. - RDMA ACKs and CNPs get their own marking. ACKs are tagged through a purpose map:
nicctl update qos dscp-to-purpose --dscp <n> --purpose rdma-ack, read back withnicctl show qos dscp-to-purpose. The CNP mark is the DCQCN option--cnp-dscp. Both must match what the switches expect. AMD’s own pages use different example values in different places, so take the numbers from your fabric design, not from one page of the guide. - Counters outlive the driver. Pollara
ethtool -Sstatistics “are not reset by reloading the driver”. Only a cold reboot or a firmware reload clears them.nicctl clear port statisticsclears the port counters thatnicctl show port statisticsprints. Read twice and subtract, as always.
For the link itself, nicctl show port fsm prints the history of link states with a timestamp and duration for each, which is the fastest way to see a flap. nicctl show port transceiver --detail reads the optic.
The mapping to ConnectX is close. FRAMES_RX_BAD_FCS is the CRC counter. FRAMES_RX_PAUSE is the pause counter. The queue-pair view splits loss, receiver-not-ready and congestion the same three ways. Find the card with lspci -d 1dd8:. The drivers are ionic and ionic_rdma. AMD requires the driver and tools to match the firmware, so check nicctl show version firmware after any swap.
Explain it to a ten-year-old. The network card counts every time someone said “wait” and every time a letter went missing. “Wait” a lot means the road is busy. Letters missing means the road is broken. Those are different problems with different fixes.
Layer 5: Cables, optics and the fabric - the last row of the map
This is the last row of the map - the physical link first, then the paths through the switches.
mlxlink -d <dev> -c -m           # BER, link down counter, module health
ethtool -m <if>                  # optic diagnostics on any NIC
ethtool -I --show-fec <if>       # FEC mode with corrected and uncorrectable blocks
perfquery -x <lid> <port>        # InfiniBand port counters, local or remote
In mlxlink I read three things: Effective Physical Errors, Link Down Counter, and whether one lane’s raw BER stands apart from its siblings [18]. Raw errors on a FEC link are normal, because FEC exists to correct them. Effective errors are the ones that got through. One lane far worse than the other three points at one fiber or one pin, not at the driver.
The reason is in the coding. Links that run 100G per lane use a Reed-Solomon code called RS(544,514). Each block of 544 symbols carries 30 spare ones, which lets the receiver repair up to 15 bad symbols per block. The link is designed to work with a raw bit error rate as poor as about 2.4 in 10,000, and still deliver better than 1 error in 10 trillion bits after correction [63]. So a steady stream of corrected errors is the design working. What matters is how close the link runs to the limit, which is what the FEC histogram shows: counts in the high bins mean blocks that nearly could not be repaired.
ethtool --show-fec prints only RS. To confirm which code is active on a ConnectX, mlxlink prints the full label, Standard_RS-FEC - (544,514).
ethtool -m reads the optic itself: temperature, voltage, laser bias and receive power, each with alarm and warning rows. Receive power near its low threshold is a dirty or bent fiber before it becomes a flap. There is no single number to memorize. Each module carries its own thresholds, and ethtool -m prints them beside the readings.
perfquery is the one host tool that can read the far end of the cable, a switch port included [19]. The counter names carry the cause [23]:
| Counter | It points at |
|---|---|
SymbolErrorCounter | The local cable, optic or connector |
LinkErrorRecoveryCounter | A marginal link that retrains without dropping. Early warning |
LinkDownedCounter | Real flaps |
PortRcvRemotePhysicalErrors | Damage upstream. This link is only the messenger |
PortXmitWait | Credit starvation. Congestion, not hardware |
PortXmitDiscards | The port is down or congested |
ExcessiveBufferOverrunErrors | Flow control is broken. Check config first |
The fourth row saves hours (it is the one I point new engineers to). A packet corrupted three hops away is forwarded marked bad, and every link after it counts it. Walk back toward the source until the counter stops.
For a whole InfiniBand fabric, ibdiagnet. The BER flags in older runbooks are deprecated. The current path is ibdiagnet --pc --reset_phy_info, wait five to ten minutes, then ibdiagnet --get_phy_info [20]. Results land in /var/tmp/ibdiagnet2/. Add -r to validate routing and find credit loops.
Then prove the path with traffic [21]:
ib_write_bw -d mlx5_0 -x 3 -q 4 -s 1048576 -D 30 --report_gbits            # server
ib_write_bw -d mlx5_0 -x 3 -q 4 -s 1048576 -D 30 --report_gbits <server>   # client
Both sides need the same options. -x picks the GID index, which on RoCE must be the v2 entry. Without --report_gbits the result is in MiB per second, so divide by 119.2. Compare the average against the port’s line rate. A peak far above the average means the stream keeps stalling.
Add --use_cuda=<gpu> or --use_rocm=<gpu> to push the data through GPU memory. The flags only exist if perftest was built with GPU support, so check with ib_write_bw -h | grep -i -E 'cuda|rocm'. Then compare the two runs. If host memory hits line rate and GPU memory does not, the fabric is innocent. Go back to Layer 1 and look at where the GPU and NIC sit.
Explain it to a ten-year-old. A cable is a straw. A cracked straw still works, but you get more air than milkshake. These tools count the air.
Multiplanar: when the fabric is four fabrics
The newest fabrics need their own section, because they break a habit. In a single fabric a dead link is loud. In a multiplanar fabric it is quiet, and quiet faults are the expensive ones.
My RDMA post explains the design, and multiplanar will get a separate post of its own. The short version, in Oracle’s words: “Each plane is an independent Clos fabric. Each fabric plane has independent data and control planes; there is no physical or logical ‘fate sharing’ between them” [29]. The GPU’s 800G NIC does not send one link to one switch. It sends four 200G links to four switches, one per plane.
When a plane fails, Oracle says traffic is “automatically shifted to use the healthy planes, enabling workloads to proceed without interruption or data loss” [29]. NVIDIA says a failing plane “will carry an impact linearly associated with the dropped bandwidth” [30]. Put those together with four planes and you get my rule of thumb: lose one plane and you keep three quarters of the bandwidth. That number is my arithmetic, not a vendor’s.
That is the feature. It is also the debugging problem - and the reason this section exists. The job does not die, so nothing pages. It runs a quarter slower, and a quarter slower looks like a busy day.
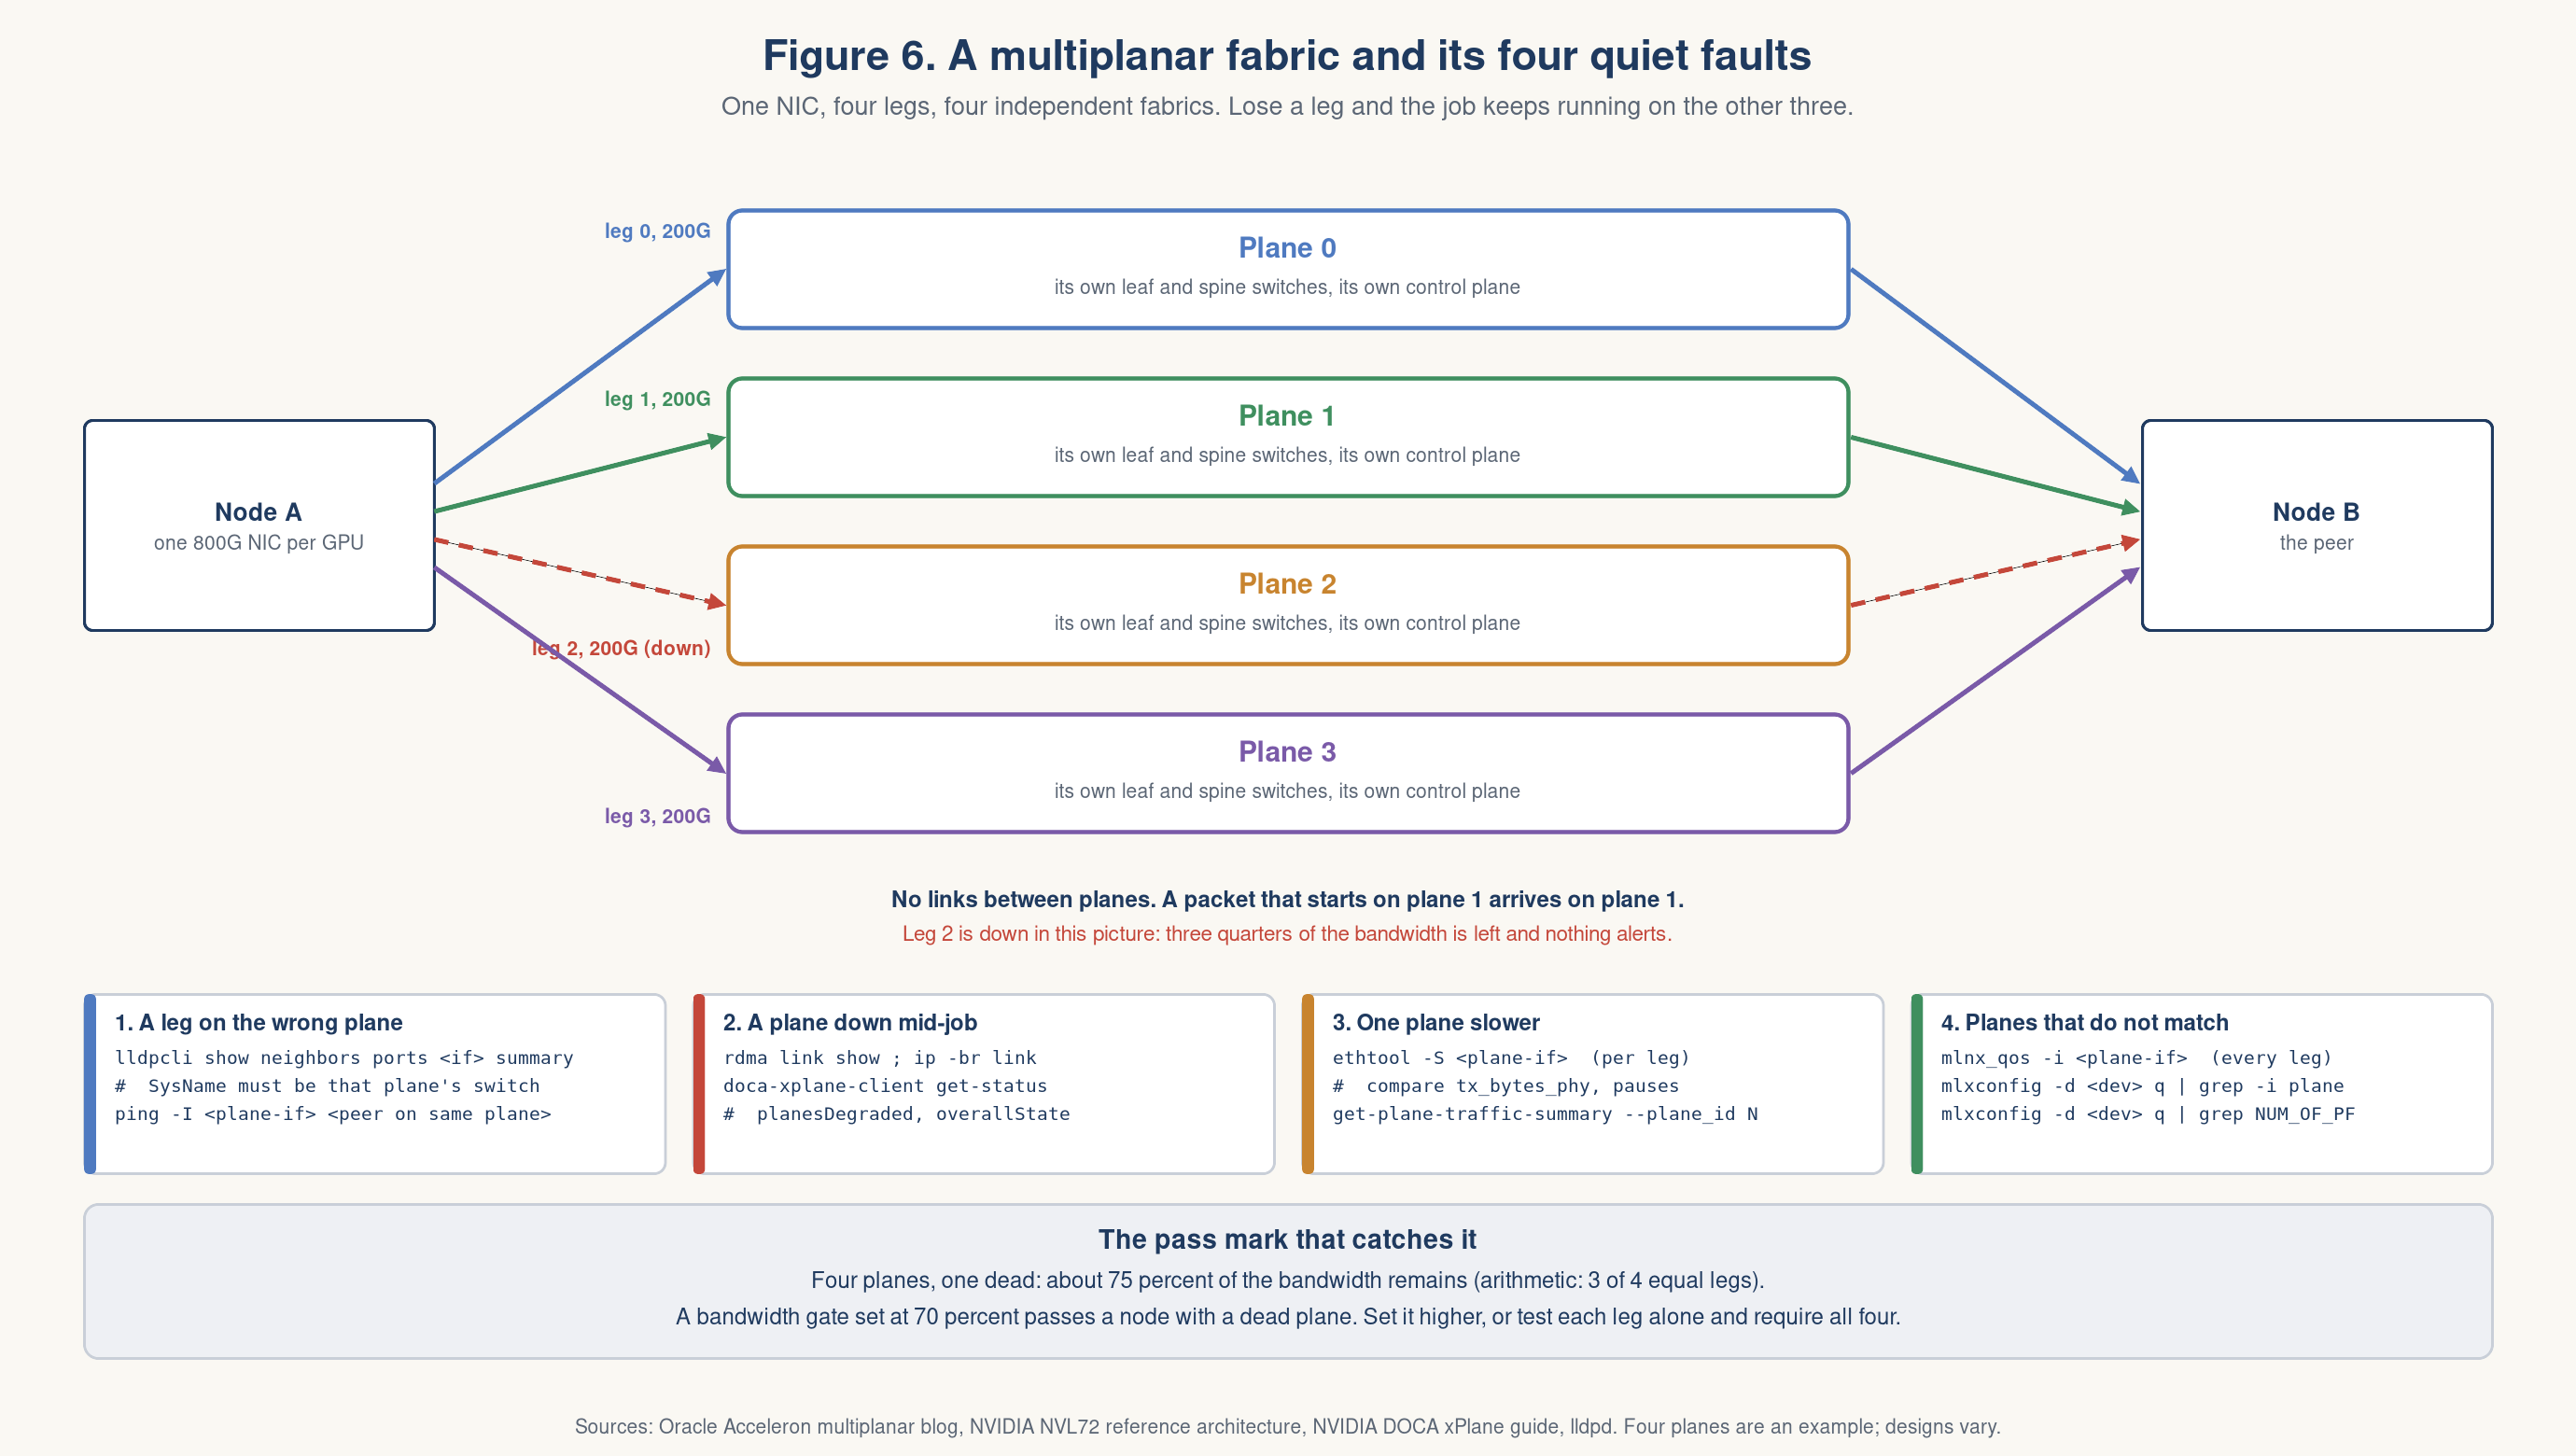
Figure 6. Four legs, four planes, and the four faults that do not page anyone.
First, know which shape your host has
NVIDIA documents three ways a multi-plane NIC can appear to Linux, and the checks differ for each [42][32]:
| Shape | What the host sees | Where a plane fault shows |
|---|---|---|
| Planes visible (software load balancing) | One netdev and one RDMA device per plane, one subnet per plane | In the ordinary tools, per plane port |
| Planes hidden (hardware load balancing) | “A single interface per rail” | Only in the plane service, doca-xplane-client |
| InfiniBand multi-plane | One aggregated data port, plus a management device with one port per plane | In the port’s effective speed |
NVIDIA is blunt about the second shape: “A degraded plane is therefore invisible from inside the Pod, and DOCA xPlane is the only place to see it” [31]. Every check in Layer 4 can come back clean on a node that has lost a plane.
Oracle has not published what its hosts see, so I will not describe it here. The method below works on any of the three.
The four faults that are new
1. A leg cabled to the wrong plane. Each NIC has four legs and each must land on the right switch in the right plane. Shuffle cables reduce the risk, and Oracle says so [29]. They do not remove it. Where the planes are visible, ask each leg who it is talking to:
lldpcli show neighbors ports <plane-if> summary     # SysName and PortID of the switch on that leg
ping -I <plane-if> <peer address on the same plane>
[36]. SysName must be a switch of that plane, and PortID the port your cabling plan expects. The check that scales is a table: for every node, NIC and plane, the switch and port it should see. Then diff what LLDP reports against the table, across the whole cluster, before the first job runs.
2. A plane that is down while the job runs. Where planes are visible, the usual commands work if you run them per plane:
rdma link show                                   # one line per plane: state, physical_state
ip -br link                                      # one line per plane netdev
ethtool -S <plane-if> | grep link_down_events_phy
Where planes are hidden, ask the plane service. This output is from NVIDIA’s docs, trimmed [32]:
$ doca-xplane-client get-status
"health": {
  "planesUp": [1],
  "planesDegraded": [0],
  "overallState": "DEGRADED",
  "failures": { "localTotal": 1, "remoteTotal": 2 }
}
A local failure is a link down on this host. A remote failure is a route the fabric withdrew, so some destinations lose the plane and others do not. doca-xplane-client get-plane-failures-remote --plane_id 0 lists which.
3. One plane slower than its siblings. The planes of one NIC should carry about the same traffic. Compare them:
for i in <plane-if-0> <plane-if-1> <plane-if-2> <plane-if-3>; do
  echo "== $i"; ethtool -S $i | grep -E "tx_bytes_phy|rx_prio3_pause|rx_pcs_symbol_err_phy"
done
One port with far fewer bytes, far more pauses or any symbol errors is the odd one out. With hidden planes, doca-xplane-client get-plane-traffic-summary --plane_id N shows what was diverted and what was dropped. Diverted traffic means failover is working. Dropped traffic means it is not.
This matters more than it looks. By default NCCL splits each message equally across the devices it has fused together [33]. Equal shares on unequal planes means the slow plane sets the pace. NCCL 2.31 added NCCL_IB_EVENT_BASED_LB, which splits by current link speed instead, and it is off by default.
4. Planes that do not match. Four legs means four chances for drift. Check QoS on every plane port, not on one: mlnx_qos -i <plane-if>. And check the firmware’s idea of the split:
mlxconfig -d <dev> q | grep -E 'NUM_OF_PLANES|NUM_OF_PF|MODULE_SPLIT|LOAD_BALANCE_MODE|LINK_TYPE'
The plane count is a firmware setting, and it needs a power cycle to change [34]. A replaced NIC arrives with factory values. One documented trap: a ConnectX-8 InfiniBand port defaults to four planes, and it must be set to one before it will work with an older single-plane switch.
Ask NCCL what it saw
NCCL prints the devices it chose at start-up. Run with NCCL_DEBUG=INFO and read the NET/IB : Using line. Count the devices. Fewer than the node has is a plane that was missing when the job began, or a filter that excluded it.
The filter is NCCL_IB_HCA, and it now takes rail and plane: <hca>:<port>:<rail>:<plane> [33]. One trap from the docs: without a leading =, mlx5_1 also matches mlx5_10 through mlx5_19. On a node with dozens of plane devices that prefix match will bite.
To test one plane at a time through NCCL, restrict it to one device per run. The = matters, for the reason above:
for d in mlx5_0 mlx5_1 mlx5_2 mlx5_3; do
  echo "== $d"
  NCCL_IB_HCA="=$d" mpirun -np 2 -H nodeA,nodeB ./build/all_reduce_perf -b 1G -e 1G -g 1
done
Four runs, four bus bandwidth figures. They should match. The one that does not is your plane. Substitute your own device names, one per plane.
Set the pass mark where a dead plane fails
This is the rule I would put first. If the bandwidth pass mark for a four-plane node is 70 percent of the expected figure, a node with a dead plane passes, because three planes deliver about 75 percent. Set the mark above that. Better, test each plane on its own with ib_write_bw -d <plane-dev> and require all four.
Explain it to a ten-year-old. There are four bridges over the river. If one bridge closes, the cars use the other three and still get across. Nobody honks. So someone has to walk out every morning and count the bridges.
Six walks down the stack: the order is the skill
Commands are easy to list. The order in which you run them is the skill. These are six scenarios I have been asked to walk through, or have lived. Each one teaches a different rule.
1. The collective is slow
An all-reduce runs slow across eight nodes. Where do you go?
Quantify first. Run all_reduce_perf from nccl-tests and read the busbw column. Bus bandwidth is the number built for this. For all-reduce it is the algorithm bandwidth times 2(n-1)/n, and NVIDIA says it “should reflect the speed of the hardware bottleneck: NVLink, PCI, QPI, or network” [35]. So compare it to that bottleneck. Across nodes the ceiling is the sum of the NIC ports. A number 20 or 30 percent low points at one slow link or one slow rank. A number near zero points at a path that fell back, to TCP or away from GPUDirect.
Bisect. Run seven nodes, then a different seven. Run pairs. The slow member shows itself. NCCL_DEBUG=INFO confirms which NICs NCCL picked.
Then walk down on the suspect. Physical link: mlxlink -d <dev> -c -m. Host: LnkSta on the NIC and the GPU, clocks and throttle reasons, nvidia-smi topo -m for the GPU to NIC distance. Fabric: pause and discard counters per priority, and a missing plane.
Knobs last. NCCL_IB_HCA, NCCL_ALGO and the rest are for after the hardware is proven clean. Tuning around a bad cable hides it.
One correction I had to learn. When the bit error rate is bad, the part to swap is the cable or the transceiver, then the far-end port. Not the NIC. In a rack-scale system the things you can service are cables, trays and switch trays.
My rule: measure against a ceiling before you touch anything, and bisect before you theorize.
2. Discards on a port that should be lossless
The link is clean. PFC is on. The switch shows no drops. The NIC shows receive discards. Now what?
Look per priority, because the answer is in which class is dropping:
ethtool -S <if> | grep -E 'prio[0-7]_(discards|pause)|rx_out_of_buffer|rx_buffer_passed_thres_phy'
There are three different faults here, and they look the same from a distance [17].
Discards on a class that is not the lossless one. Say PFC protects class 3 and the drops are on class 4. This is not congestion. The RDMA traffic is landing in the wrong class. Check the NIC’s trust mode and DSCP map with mlnx_qos -i <if>, then check what the application marks. NCCL sets it with NCCL_IB_TC. A common convention is 106, which is DSCP 26 with the ECN-capable bit set. Then look for a switch rewriting the mark on the way. Fix the marking, not the buffers.
Discards on the lossless class, with pauses flowing. The pause arrived too late. A pause frame takes time to cross the cable, and the bytes already in flight must fit in the space left. That space is the headroom. The driver derives the pause threshold from cable length, link speed and MTU together [40]. mlnx_qos takes the length as --cable_len, in metres. A longer cable or a faster link needs more room. Re-check it after any cable change.
Discards because the host cannot drain. If the NIC’s own PCIe link is weak, packets pile up behind it. The NIC says so:
| Counter | The kernel doc’s meaning [17] |
|---|---|
outbound_pci_stalled_rd, _wr | Percent of the last second the NIC was stalled on PCIe credits |
outbound_pci_buffer_overflow | Packets dropped because traffic arrives faster than the PCIe bus can take it |
rx_pci_signal_integrity | PCIe physical errors seen by the NIC |
Then confirm at Layer 1 with lspci -vv, or with mlxlink -d <dev> --port_type PCIE -c.
Two questions come next. Why not turn PFC on for every class? Because pauses spread, and lossy classes exist on purpose. Where does ECN fit? It marks packets before the pause threshold, so senders slow down first. Pauses should be the rare backstop, not the steady state.
My rule: the class that drops tells you whether it is marking, headroom or the host.
3. The node that passes every test and is still slow
One node drags a job. The collectives are fine. The network is fine. Every diagnostic passes.
Start with which rank is slow, from the job’s own step times. Then look at what short tests cannot see, which is anything that needs time and heat:
nvidia-smi --query-gpu=index,temperature.gpu,power.draw,clocks.current.graphics,clocks_event_reasons.hw_thermal_slowdown,clocks_event_reasons.sw_thermal_slowdown,clocks_event_reasons.hw_power_brake_slowdown,clocks_event_reasons.sw_power_cap --format=csv -l 5
amd-smi metric --violation
sudo ipmitool sel elist
sudo ipmitool sdr type Temperature
A GPU that is being throttled is not broken. It is protecting itself. Swapping it fixes nothing.
I have lived this one. A small share of early racks of a new generation overheated and throttled, and only after about two days of sustained load. Every quick acceptance test passed. Users would have found it in production.
What worked, in order. I drained the rack and swapped in a spare, so the harm stopped first. I compared a bad rack with a healthy one. I grouped the bad racks by build and by firmware to see what they shared. I kept three suspects apart: a real thermal problem in the hardware, firmware that throttles when it should not, and sensors that report the wrong state. And I built a recipe that reproduced the fault on demand: a real training workload, NCCL tests and ib_write_bw together, held for two days, with the OS logs, dmesg and the BMC log saved.
That recipe mattered most. I did not send the vendor a ticket that said racks overheat. I sent something they could run. A reproduction gets a fix. A complaint gets a queue number.
My rule: some faults need hours and heat. A soak with a real workload is a test, not a formality.
4. Healthy GPUs that fail the test
Now the opposite. GPUs fail a diagnostic. Every hardware check on them is clean.
I did not start with the GPUs. I lined up the failures by when they happened. They all landed at 28 minutes. A normal run takes about two hours.
Hardware does not fail on a schedule. Software does. The timer was in our own wrapper. Two tools shared one diagnostic interface, so we had added a lease to keep them apart, and the lease carried an inner timer that was far shorter than the test. Healthy runs were being cut off and reported as failures.
The fix was to remove the inner timer, give the outer budget real room, and release the lease only if the caller still owns it. The lesson was bigger than the fix. A wrapper can lie about the thing it wraps. So a result has three values, not two. Slow, failed and missing are different, and each gets its own handling. Missing evidence is never a pass. It is also not a failure.
Three design points follow, and I would apply them to any test harness.
- Draw the timeout ladder. Every layer needs more time than the layer inside it: test, then wrapper, then lease, then scheduler. Raising all of them blindly hides a hung process as surely as a short one kills a healthy run.
- Release a lease only if you still own it, in one step. Suppose worker A’s lease expires, worker B takes it, and A then runs its cleanup. If A deletes the lease without checking, it removes B’s protection. The check and the release must be atomic.
- Rules first, model second. If a triage service uses an AI model, put deterministic rules in front of it: an Xid, a link down, a failed remap, a known firmware mismatch. Let the model see only what the rules could not classify, and act on its answer only above a confidence bar. A harness that cannot tell “failed” from “missing” will feed that confusion to anything downstream.
My rule: when failures share a timestamp, suspect the harness before the hardware.
5. The count says hardware. The evidence says configuration.
A steady stream of nodes comes back reported as faulty. The count says hardware defects.
I did not trust the count. I went through the returned nodes themselves. Each had a snapshot of its OS. Most were not hardware at all. The host tuning and the RDMA setup had drifted, because they were scripts, and scripts get edited.
The easy reading is user error. If most people break the script, the script is the design flaw. The fix was to stop shipping a script and ship a managed agent that owns the configuration.
For debugging, the lesson is a step to add before any repair ticket. Diff the node against a known good one:
mlxconfig -d <dev> q                 # firmware settings
mlnx_qos -i <if>                     # trust and PFC, which do not survive a reboot
ethtool -i <if>                      # driver and firmware versions
sysctl -a                            # kernel tuning
My rule: ask for the spread of root causes before you believe a failure count.
6. Every node is clean and the loss curve is not
A very large job converges slowly and its loss curve jitters, but only at full scale. Every node has clean numerics. No Xid, no ECC, no link errors.
Nothing is broken. Floating-point addition is not associative, so the order in which gradients are summed changes the answer slightly. In a long chain of additions the worst-case rounding error grows with the length of the chain. Summing in pairs, as a tree, grows with its logarithm [37].
A ring all-reduce sums along the ring. A tree sums in levels. Both do the same number of additions [35]. What differs is how many depend on each other in a row. NCCL’s own maintainer puts it plainly: “Ring, by nature, has a worse precision than say Tree” [41].
Two cautions. NVIDIA does not publish the chain depths, so treat that part as reasoning from the shape of the algorithm. And accuracy is not the same as reproducibility. A ring gives the same bits every run for a fixed layout, which is why NVIDIA’s Megatron guide recommends it when you need exact reproducibility.
The test is cheap. Pin NCCL_ALGO=Tree for one run and compare the curves. NCCL lists that variable under debugging and says not to leave it in production scripts [33]. Other remedies people use are to reduce in FP32 even when the model runs in a smaller type, and to let each node reduce locally first. I have not verified those against a vendor source.
My rule: when every component passes, look at what only exists at scale.
The triage flow: from symptom to root cause
Figure 7 puts it together. Nine symptoms, the first commands, the line that gives it away, and the usual cause. They run from loud to quiet. A missing GPU pages someone. A job that fell back to TCP alerts nobody and costs more.
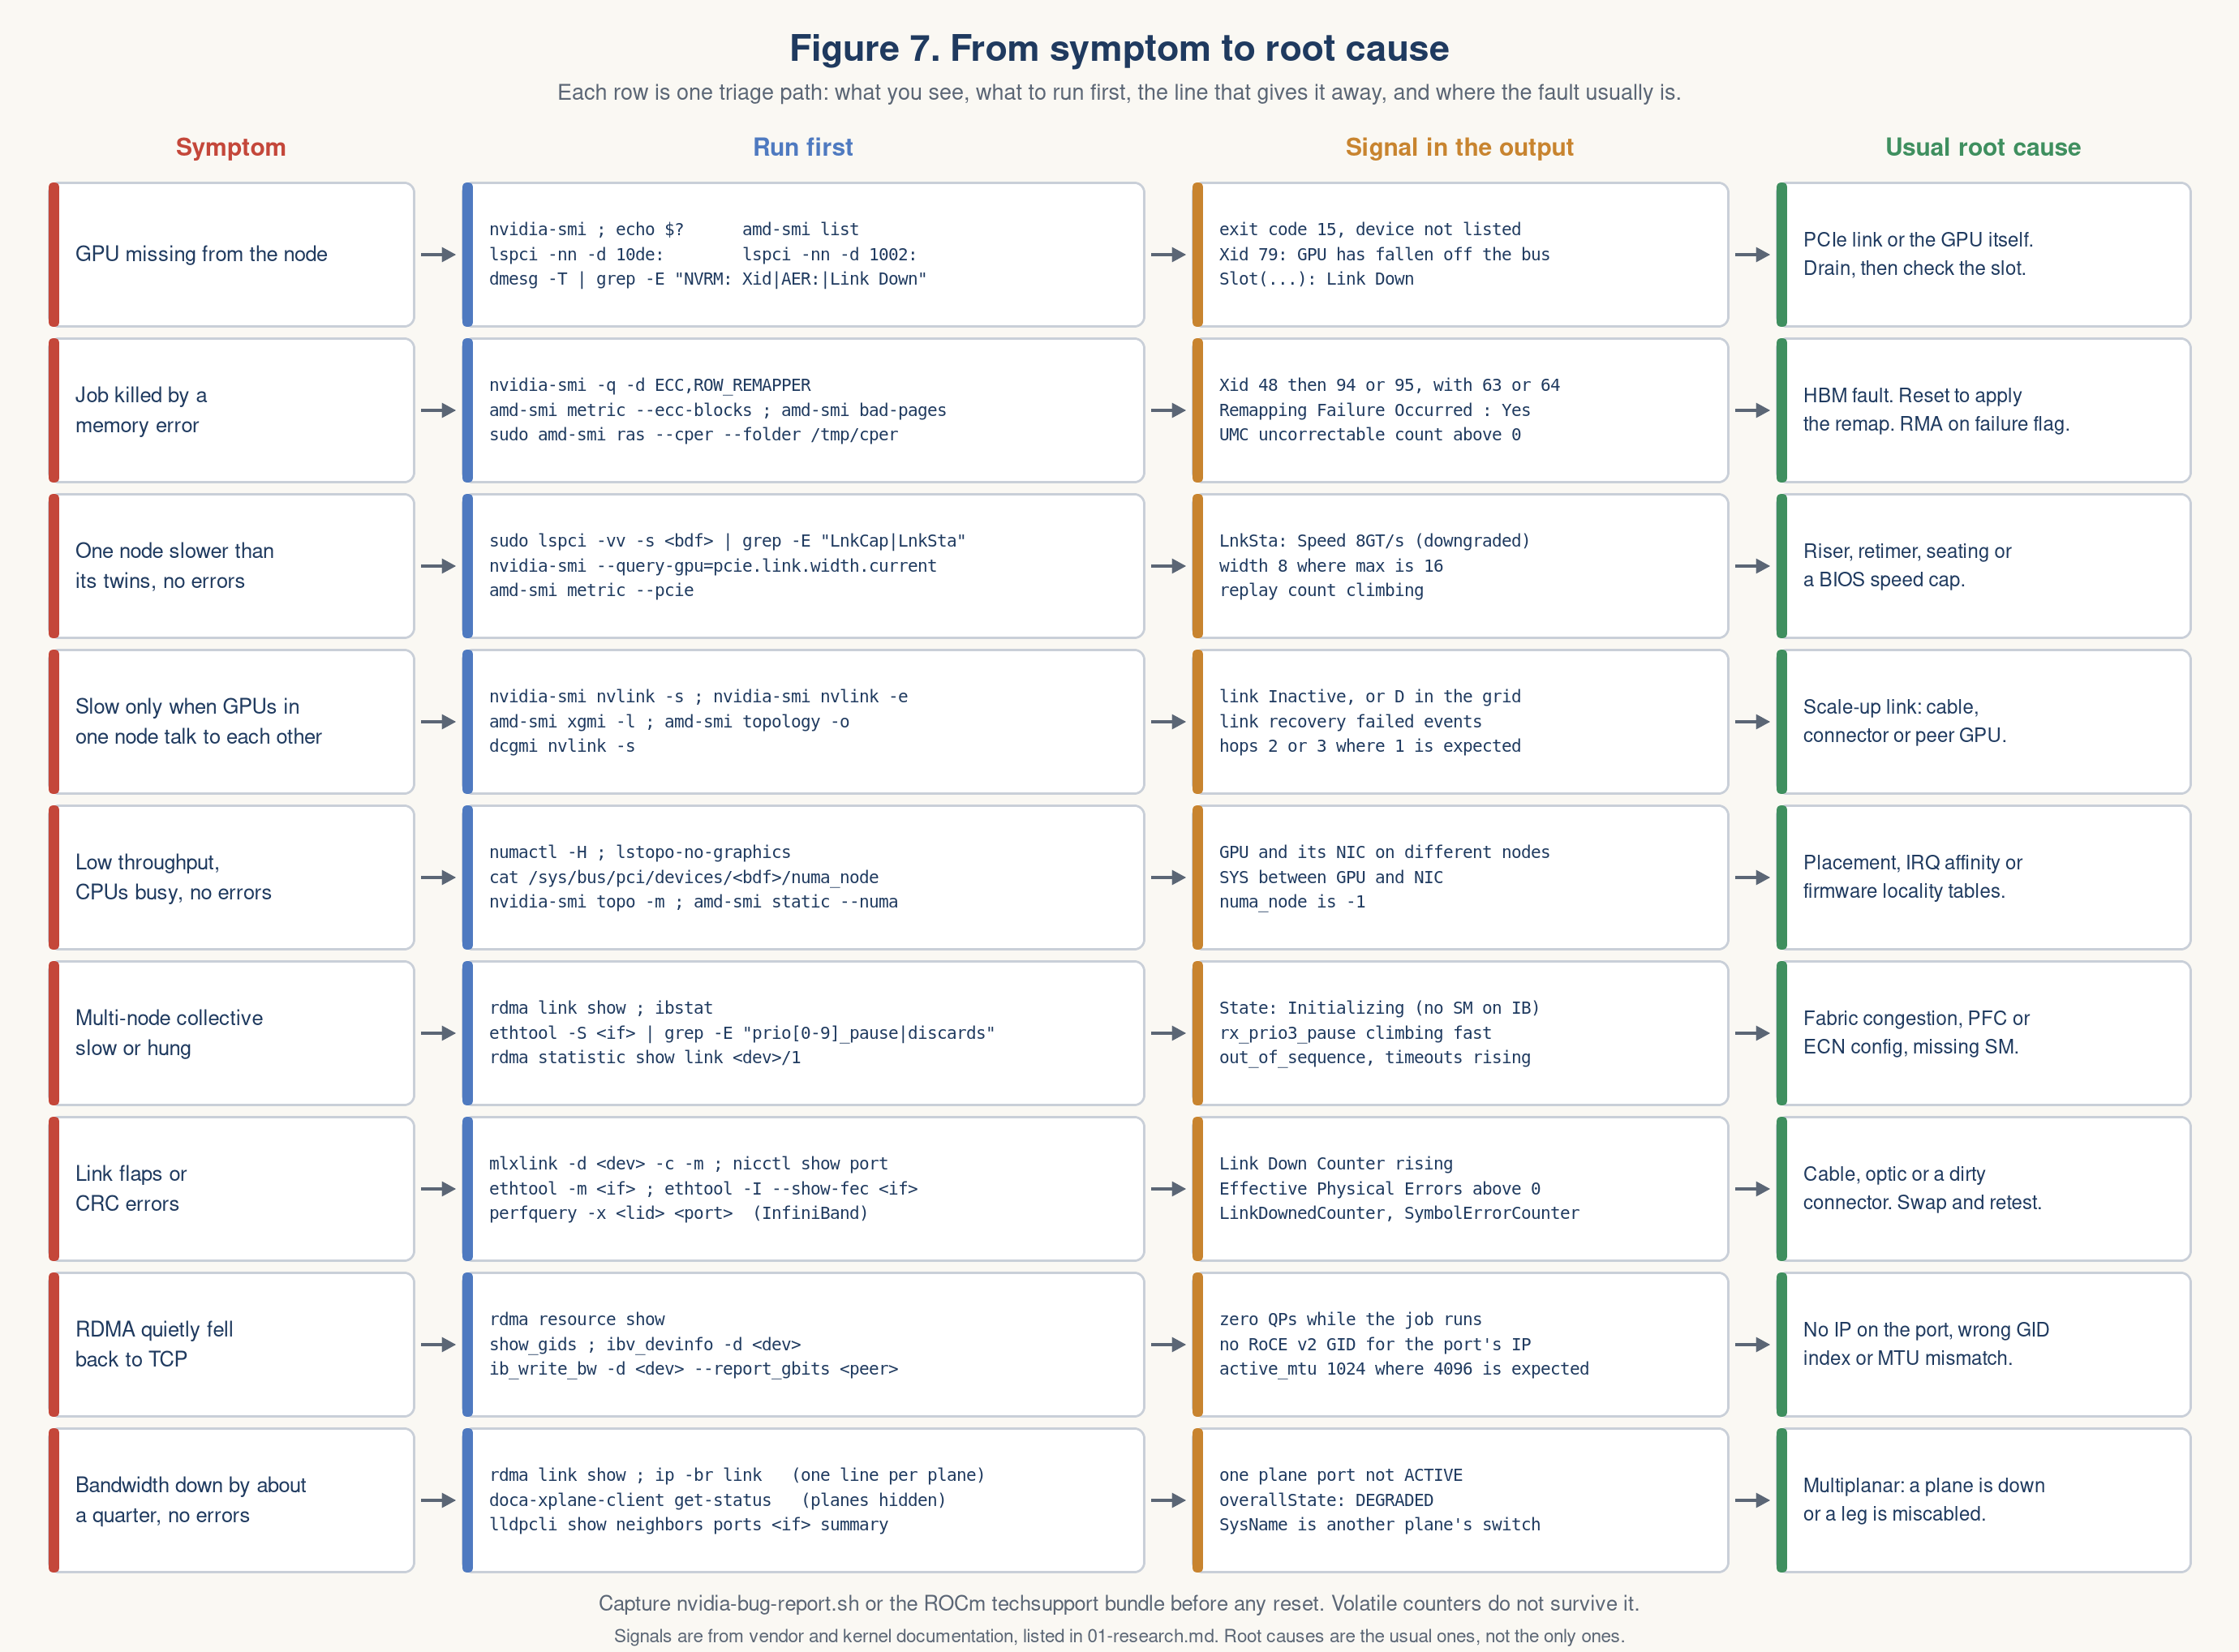
Figure 7. Nine symptoms, the first commands, the giveaway line and the usual cause.
The USE method, for both vendors
I come back to Brendan Gregg here. His USE method asks three questions of every resource: how busy is it, is work queueing behind it, and is it reporting errors [48]. Figure 8 answers those three questions for each part of a GPU node. I check errors first (Always!), because an error explains a slowdown and utilization alone rarely does.
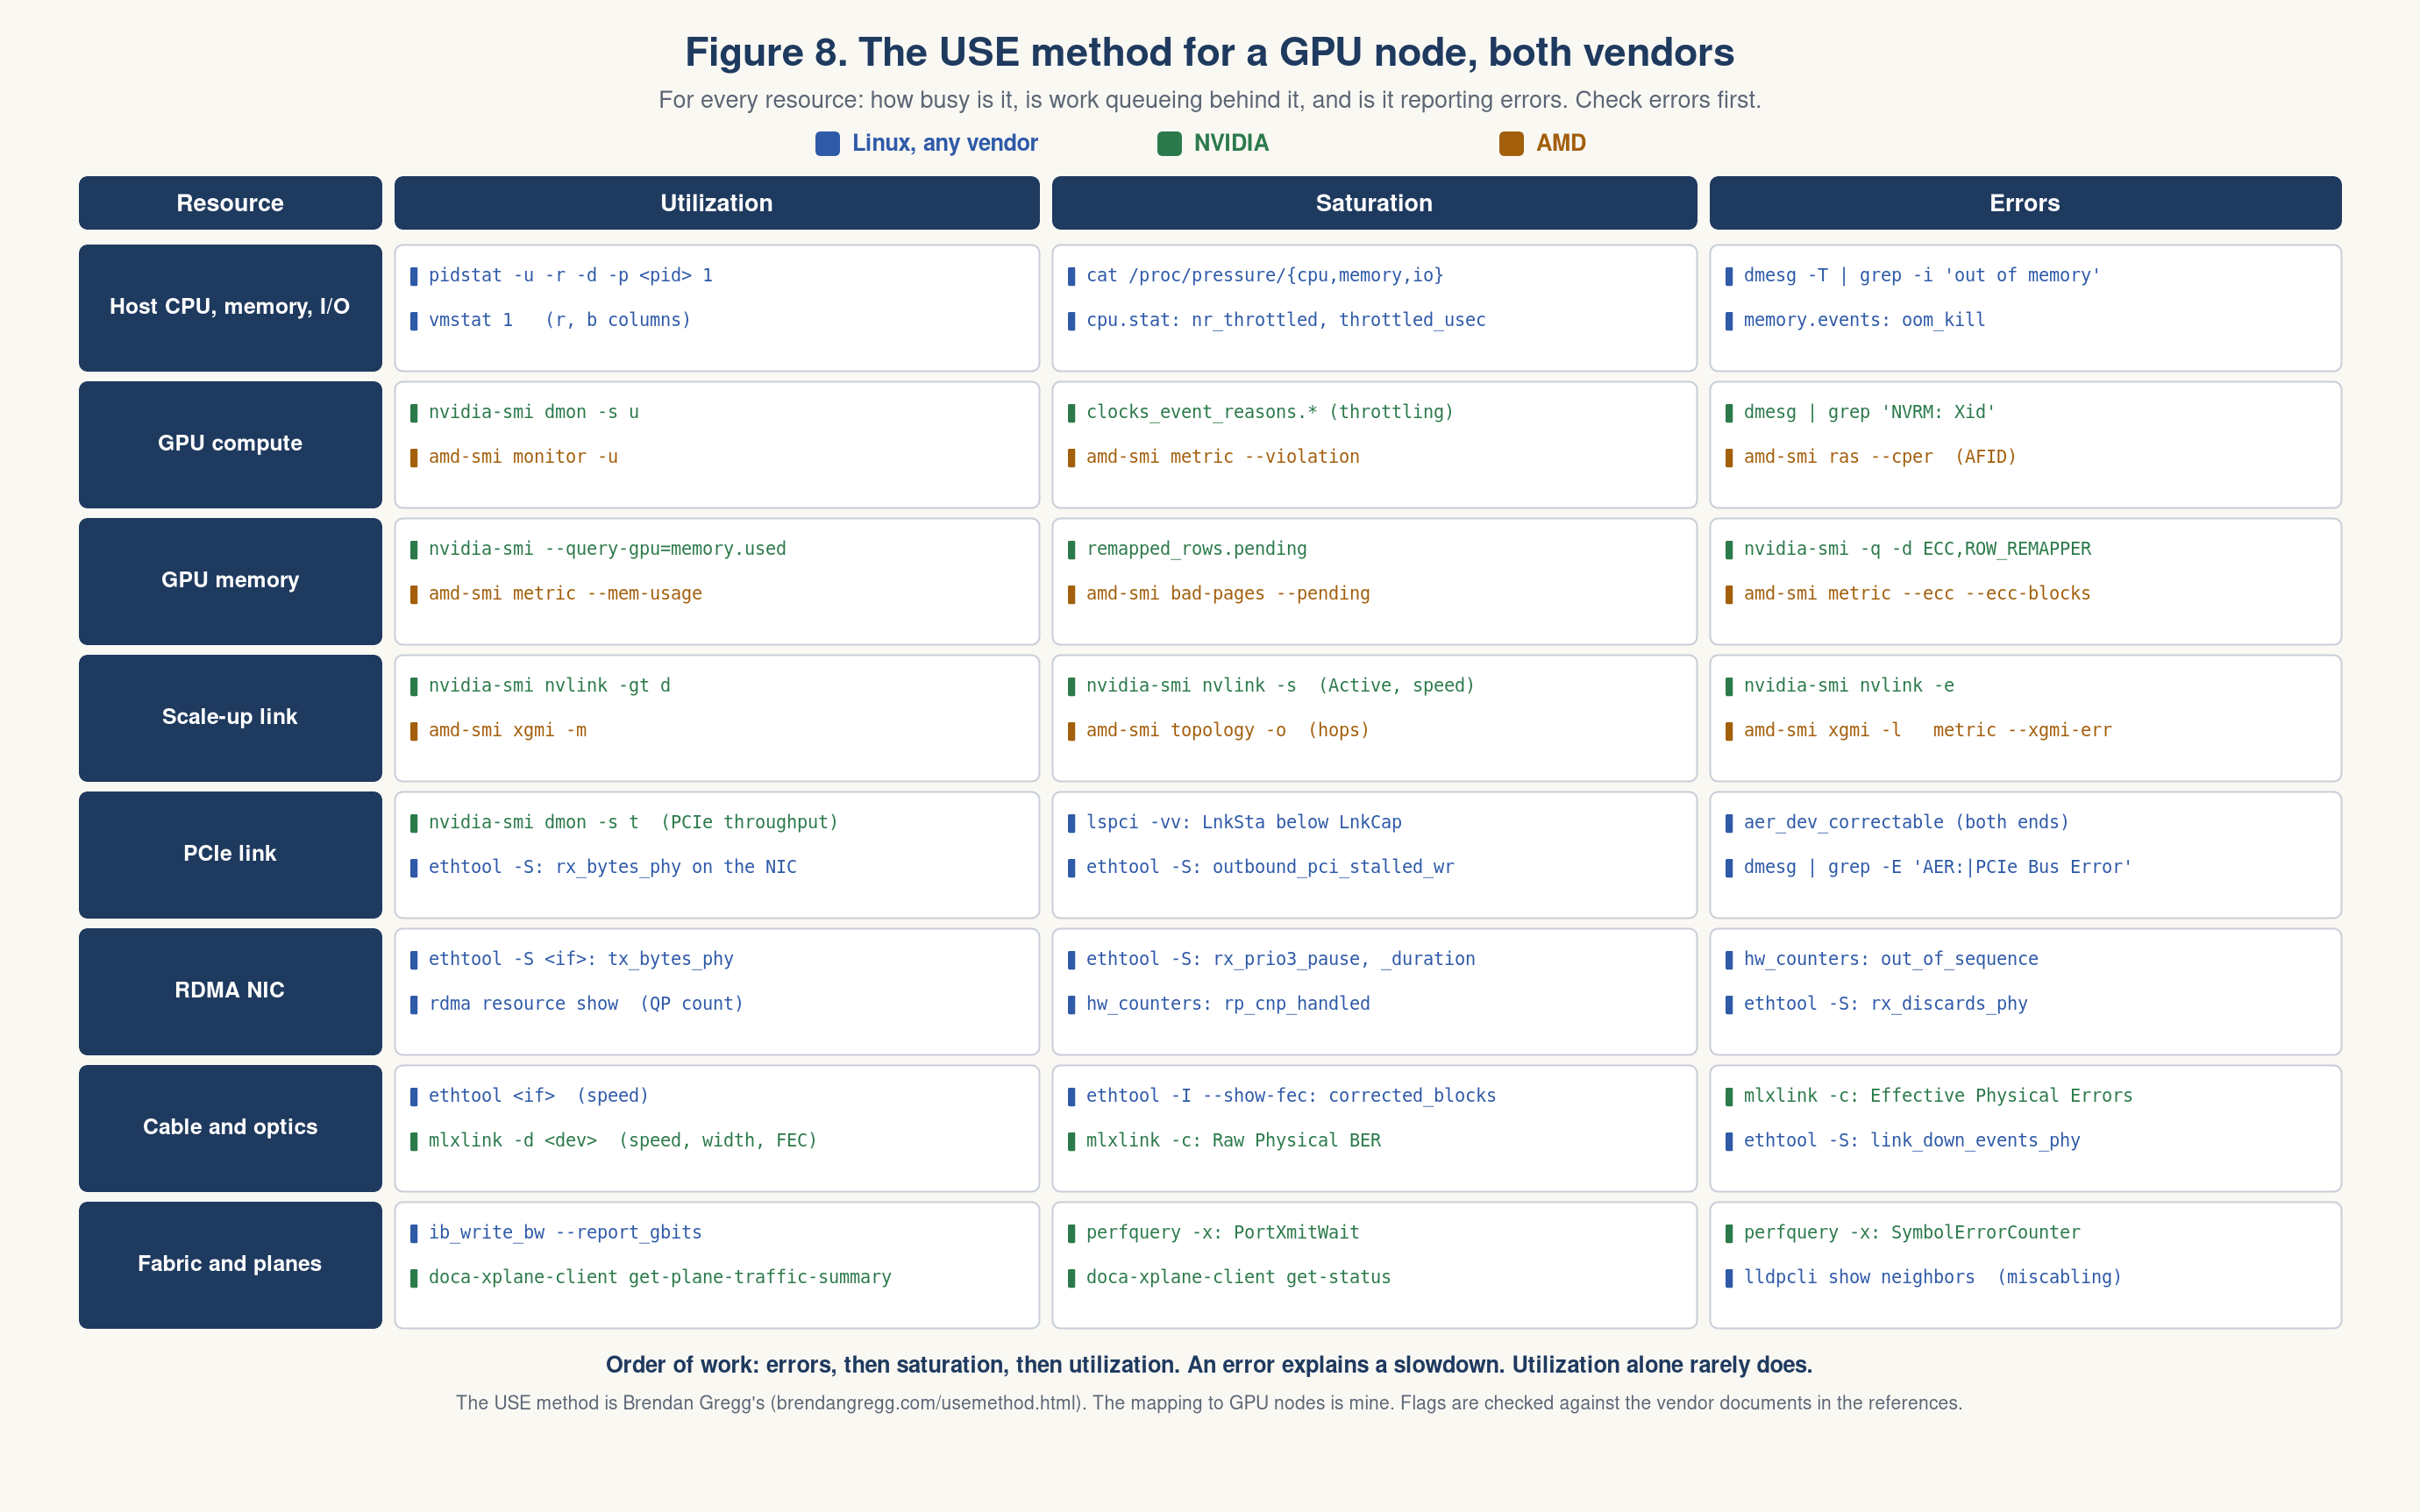
Figure 8. Utilization, saturation and errors for every resource, with the command for each.
NVIDIA to AMD cheat sheet
If you know one vendor’s commands, this table gets you to the other’s.
| Job | NVIDIA | AMD |
|---|---|---|
| Summary and inventory | nvidia-smi, nvidia-smi -L | amd-smi, amd-smi list -e |
| Full dump | nvidia-smi -q | amd-smi static plus amd-smi metric |
| Live monitor | nvidia-smi dmon, pmon | amd-smi monitor, amd-smi process |
| Topology | nvidia-smi topo -m | amd-smi topology, amd-smi static --numa |
| GPU to GPU link | NVLink: nvidia-smi nvlink -s, -e | xGMI: amd-smi xgmi -l, amd-smi metric --xgmi-err |
| PCIe link | --query-gpu=pcie.link.width.current | amd-smi metric --pcie |
| Error vocabulary | Xid in dmesg | RAS block counts, CPER records, AFID |
| Memory repair | Row remapping | Bad page retirement: amd-smi bad-pages |
| Throttling | clocks_event_reasons.* | amd-smi metric --violation |
| Active diagnostic | dcgmi diag -r 1..4 | rvs -c <conf>, rvs -r 1..5 |
| Telemetry exporter | DCGM, dcgm-exporter | AMD Device Metrics Exporter |
| Support bundle | nvidia-bug-report.sh | rocm_techsupport.sh |
| Collectives | NCCL | RCCL, same ncclXxx API and NCCL_* variables [25] |
| GPU direct RDMA | GPUDirect RDMA | dma-buf path, check rocminfo for DMAbuf Support |
| AI NIC tool | mlxlink, mlxconfig, mlnx_qos | nicctl on Pollara |
The fit is loose in three places. AMD’s xGMI error counter is one value since the last read, coarser than NVLink’s per-link set. An AFID tells you what kind of event happened, where an Xid usually comes with a recommended action. And NVIDIA’s driver states its own verdict in GPU Recovery Action. I found no AMD field that does the same.
What healthy means - my definition of done
Debugging needs a definition of done. Mine is short, and each line maps to a row of the map:
- Zero Xid errors, and no new RAS records on AMD
- Zero uncorrectable memory errors, and no remap or bad-page retirement pending
- Every link active: PCIe at full speed and width, every NVLink or xGMI link up, every RDMA port, every plane
- Fabric IDs match across the rack
- Bandwidth inside a band around a known-good baseline, per GPU type and per fabric
- No throttling
- Step time stable through a soak
Test in layers so that drilling down stays cheap: one tray first, then the rack, then between racks. My burn-in post covers that ladder.
One sentence I keep coming back to: trust your vendor, but write your own tests from the spec. The vendor’s diagnostic tells you the part meets the vendor’s bar. Only your test tells you it meets yours.
The whole post in six lines
- The job reports the failure, not the journey of the failure. Walk down, compare, trust the counters, capture (W, C, T, C).
- PCIe first.
LnkStabelowLnkCapexplains more slow nodes than anything else, and both ends of a link keep their own error counts. - NVIDIA gives you a number, the Xid. AMD gives you a block name and, after decoding, an AFID.
- On RoCE, pauses mean busy and sequence errors mean broken. Do not fix one as if it were the other.
- A multiplanar fabric fails quietly. Count the planes, and set the pass mark where a dead plane fails.
- Capture the support bundle before the reset.
Appendix A: Versions These Commands Were Checked Against
Flags move between releases. Everything above was checked on 2026-11-15 against these versions. Check yours before you paste.
| Tool | Version checked | Note |
|---|---|---|
| pciutils | 3.8.0 and newer | Older versions tag every link, healthy ones included |
| Linux kernel | 5.15 to 6.12 | AER wording changed around 6.8 |
| NVIDIA driver | 580 branch | nvidia-smi help and docs |
| DCGM | 4.7.0 | Field names changed in 4.6.0. IDs did not |
| amd-smi | 26.1.0 to 27.2.0 | ROCm 7.1 to 10.2. Bare amd-smi prints a summary only on 27.x |
| RVS | 1.8.0 | gm, pesm and smqt deprecated since 1.7.0 |
| MFT | 4.36.0 | mlxlink, mlxconfig |
| ibdiagnet | 2.26.0 | --ber_test and --get_cable_info deprecated |
| AMD UG1801 | rev 1.9 | nicctl reference for Pollara 400 |
| NCCL | docs up to 2.32u1 | Plane syntax in NCCL_IB_HCA; NCCL_IB_EVENT_BASED_LB since 2.31 |
| NVIDIA Network Operator | 26.7 | Spectrum-X multiplane modes |
| DOCA xPlane | ConnectX-8 firmware 40.48.1000 or newer | doca-xplane-client |
| ipmitool, dmidecode, lldpd | upstream man pages | BMC log, firmware inventory, LLDP neighbors |
| sysstat, PSI, cgroup v2 | upstream man pages and kernel docs | PSI needs kernel 4.20 or newer |
| AMD partitioning | amd-smi 27.x docs | amd-smi reset -r is gone in newer releases; reload the driver |
| AMD UG-70122 | rev 1.0 | AFID list |
Appendix B: What to Capture Before You Change Anything
A reset, a driver reload or a reboot destroys evidence. Collect this first, and hand it over with the ticket.
| Capture | What to keep | Command |
|---|---|---|
| Identity | GPU UUID and PCI address, NIC PCI address, RDMA device, port, netdev, rail and plane, and the peer’s | nvidia-smi -L, amd-smi list -e, lspci -nn, rdma link show, ibdev2netdev |
| Versions | Kernel, GPU driver, NIC firmware, BIOS, NCCL or RCCL | uname -r, nvidia-smi, amd-smi version, ethtool -i <if>, dmidecode -t bios |
| Timing | Start and end of the bad interval, in UTC | date -u, job logs |
| Kernel log | The whole log, not the one line you liked | dmesg -T > dmesg.txt, journalctl -k -b -1 > prev-boot.txt |
| Counters | Two readings, a known time apart | ethtool -S <if>, hw_counters, aer_dev_correctable |
| GPU state | Memory errors, remaps, recovery action, link state | nvidia-smi -q > smi.txt, amd-smi metric --json > metric.json |
| Vendor bundle | Everything the vendor will ask for | nvidia-bug-report.sh, rocm_techsupport.sh, nicctl show techsupport -o <dir> |
| Out of band | What the BMC saw | ipmitool sel elist > sel.txt |
| Reproduction | The exact command, sizes, memory type, placement | the command line itself, and the output of every run |
| Comparison | The same captures from a healthy twin | all of the above, on the twin |
Then write the open question as something testable. “Rail B is slow” can mean five things. “The same host-memory test is slower on rail B against two different peers, while rail A matches the control” names the evidence and its limit.
Attach the attempts that failed, too. A command the tool rejected, a counter that does not exist on that NIC, a switch you could not reach. Those are gaps in the evidence. They are not a clean result.
A good handoff lets the next engineer answer three things: what failed, what has been ruled out by a test that could have caught it, and what observation would change the diagnosis.
Appendix C: Where Each Command Is Documented
Every command in this post, with the public document that defines it.
| Command | Read by | Public documentation |
|---|---|---|
lspci, setpci | PCI config space | man7.org |
dmesg | Kernel ring buffer | man7.org |
journalctl -k | Kernel log across boots | man7.org |
| AER sysfs counters | Kernel PCIe error counts | www.kernel.org |
numactl, numastat | NUMA policy and placement | man7.org |
taskset | CPU affinity of a process | man7.org |
lstopo | hwloc topology | www.open-mpi.org |
vmstat, iostat, pidstat | Host CPU, memory, disk | man7.org |
/proc/pressure/* | Pressure stall information | docs.kernel.org |
| cgroup v2 files | Container limits | docs.kernel.org |
ip | Netdev state and counters | man7.org |
ethtool | NIC driver, counters, optics, FEC | man7.org |
mlx5 ethtool -S counters | ConnectX counter meanings | docs.kernel.org |
rdma | Kernel RDMA devices, links, QPs | man7.org |
| RDMA sysfs counters | Port and hardware counters | www.kernel.org |
ibv_devinfo, ibv_devices | Verbs devices | github.com |
ibstat, perfquery, iblinkinfo, sminfo | InfiniBand diagnostics | github.com |
ib_write_bw and perftest | RDMA traffic tests | github.com |
ipmitool | BMC event log and sensors | github.com |
dmidecode | Firmware inventory | github.com |
lldpcli | LLDP neighbors | github.com |
nvidia-smi | NVIDIA GPU state | docs.nvidia.com |
| Xid errors | NVIDIA driver error codes | docs.nvidia.com |
| NVIDIA memory errors | Row remapping, containment | docs.nvidia.com |
dcgmi | DCGM health, diagnostics, fields | docs.nvidia.com |
| DCGM field IDs | Field names and numbers | docs.nvidia.com |
nvidia-bug-report.sh | NVIDIA support bundle | docs.nvidia.com |
| NCCL variables | Collectives, NIC and plane selection | docs.nvidia.com |
| nccl-tests | all_reduce_perf, bus bandwidth | github.com |
amd-smi | AMD GPU state, RAS, xGMI | rocm.docs.amd.com |
| amdgpu RAS sysfs | Kernel RAS counters, bad pages | docs.kernel.org |
| AFID list | AMD Field IDs | docs.amd.com |
rocminfo | ROCm runtime view | rocm.docs.amd.com |
rvs | ROCm Validation Suite | rocm.docs.amd.com |
| RCCL | AMD collectives | rocm.docs.amd.com |
| AMD system acceptance | Health checks, RDMA benchmarks, techsupport | instinct.docs.amd.com |
mlxlink | ConnectX link, BER, module | networking-docs.nvidia.com |
mlxconfig | ConnectX firmware settings | networking-docs.nvidia.com |
mlxfwmanager | ConnectX firmware versions | networking-docs.nvidia.com |
mlnx_qos | Trust, PFC, buffers | networking-docs.nvidia.com |
| RoCE on ConnectX | GIDs, RoCE version, cma_roce_mode | networking-docs.nvidia.com |
ibdiagnet | InfiniBand fabric diagnostics | networking-docs.nvidia.com |
doca-xplane-client | Multiplane status | networking-docs.nvidia.com |
| Spectrum-X multiplane | Plane modes, troubleshooting | docs.nvidia.com |
nicctl | AMD Pollara 400 | docs.amd.com |
References
- lspci(8) and pcilib(7), Linux man pages
- The PCI Express Advanced Error Reporting Driver Guide, Linux kernel documentation
- sysfs-bus-pci-devices-aer, Linux kernel ABI documentation
- numactl(8), Linux man pages
- hwloc: I/O Devices, Open MPI project
- nvidia-smi documentation, NVIDIA
- Xid Catalog, NVIDIA
- Row Remapping, NVIDIA GPU Memory Error Management
- DCGM Diagnostics, NVIDIA
- AMD SMI CLI tool, AMD ROCm documentation
- AMDGPU RAS Support, Linux kernel documentation
- AMD Field ID Guide (UG-70122), AFID Event List
- AMD Instinct MI300 series microarchitecture, AMD ROCm documentation
- ROCm Validation Suite, AMD
- rdma(8), rdma-link(8), rdma-resource(8), rdma-statistic(8), Linux man pages
- ethtool(8), Linux man pages
- mlx5 ethtool counters, Linux kernel documentation
- mlxlink Utility, NVIDIA MFT 4.36.0
- perfquery(8), rdma-core
- ibdiagnet 2.26.0, Bit Error Rate
- perftest, linux-rdma
- AMD AI NIC Pollara 400 Operations and Troubleshooting Guide (UG1801)
- sysfs-class-infiniband, Linux kernel ABI documentation
- Ethernet QoS (mlnx_qos), NVIDIA DOCA
- RCCL documentation, AMD ROCm
- ROCm techsupport, AMD Instinct system acceptance guide
- GPU Node Triage, NVIDIA GPU Debug Guidelines
- Brendan Gregg, Systems Performance, 2nd Edition, and Linux performance tool maps
- First Principles: Oracle Acceleron Multiplanar Networking Architecture, Oracle
- Networking Physical Topologies, NVIDIA Enterprise Reference Architecture for NVL72
- Spectrum-X: Verify and Troubleshoot, NVIDIA Network Operator 26.7
- DOCA XPlane Service Guide, NVIDIA
- NCCL Environment Variables, NVIDIA
- ConnectX-8 Port Configurations, NVIDIA
- nccl-tests, Performance
- lldpcli(8), lldpd
- N. J. Higham, The Accuracy of Floating Point Summation, SIAM J. Sci. Comput. 14(4), 1993
- ipmitool(1)
- UEFI Specification 2.10, PCI Bus Support
- mlx5 port buffer configuration, Linux kernel source
- NVIDIA/nccl issue 1055, on the precision of Ring and Tree
- Spectrum-X NIC Configuration, NVIDIA Network Operator 26.7
- vmstat(8), Linux man pages
- iostat(1), sysstat
- pidstat(1), sysstat
- PSI: Pressure Stall Information, Linux kernel documentation
- Control Group v2, Linux kernel documentation
- Brendan Gregg, The USE Method
- GPUDirect RDMA, NVIDIA
- NCCL Troubleshooting: GPU, NVIDIA
- nvidia-peermem, NVIDIA driver README
- DGX OS 7 User Guide, DGX Software Stack
- GPU Partitioning, AMD SMI documentation
- MI300X GPU Partitioning Overview, AMD Instinct documentation
- NVIDIA H100
- NVIDIA H200
- NVIDIA GB200 NVL72
- AMD Instinct MI300X
- AMD Instinct MI325X
- ConnectX-7 VPI Adapter Cards, Introduction, NVIDIA
- ConnectX-8 SuperNIC, Specifications, NVIDIA
- AMD ROCm blog, RCCL and xGMI on MI300X
- P. Anslow, RS(544,514) FEC performance, IEEE 802.3cd contribution
- Compute Shapes (NVIDIA and AMD GPU shapes), Oracle Cloud Infrastructure documentation
- Brendan Gregg, Linux Performance (the observability tool maps)
- numastat(8), Linux man pages
- taskset(1), Linux man pages
- Understanding Your Grace-Blackwell Systems, NVIDIA Multi-Node NVLink Tuning Guide
- NVIDIA DGX GB200, specifications
- Components, NVIDIA Enterprise Reference Architecture for NVL72