GPU Burn-In at Scale: Commands, Gates, and Troubleshooting for NVIDIA and AMD Clusters
7,762 words · 39 min read
Disclaimer: This post reflects my personal views and does not represent the views of my employer or my community.
Images generated with Grok.
Executive Summary
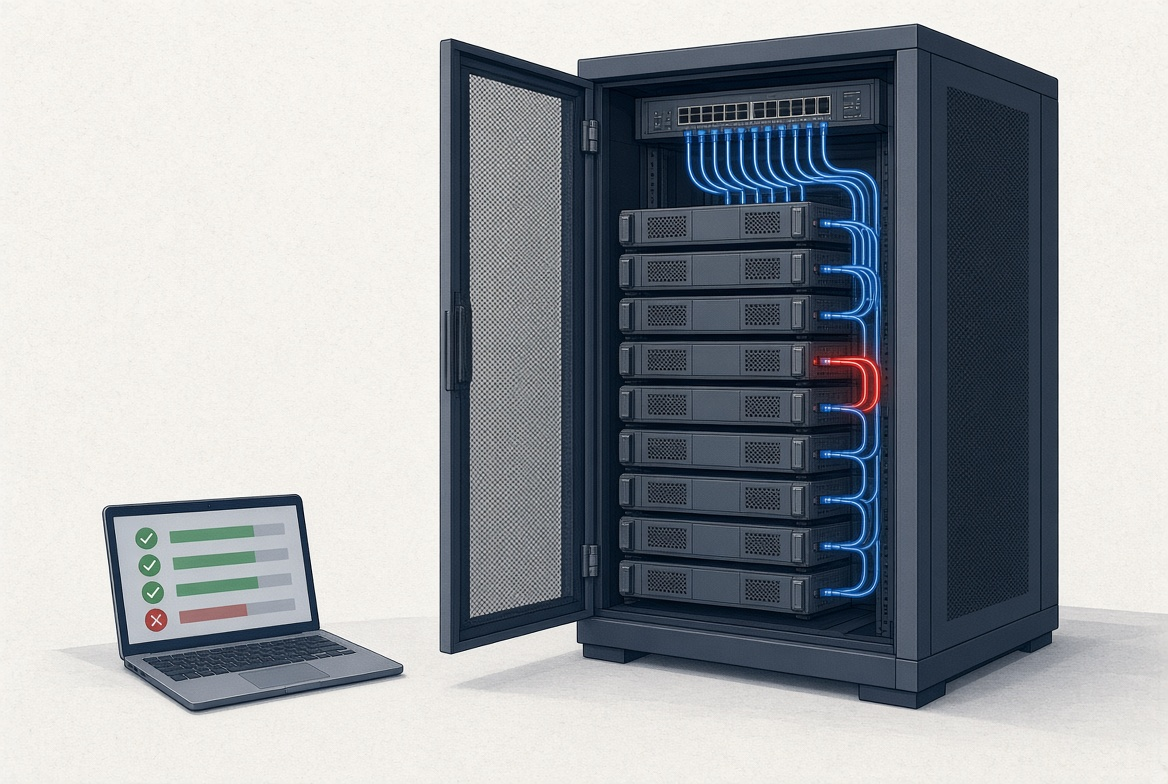
A GPU cluster that powers on is not necessarily a cluster that will train your latest model. Somewhere along the supply chain there is always one component waiting to break it: a faulty memory chip, a loose cable, a switch port that drops packets faster than you lose money in a Las Vegas casino. None of these faults show up at idle. Most of the time they show up when you are in the middle of releasing your latest Fable or Astra model, with the world waiting.
Burn-in (no, it does not mean burning the house down, it is an engineering term) is running hardware under duress to find those expensive failures fast. Fail fast, on your time. At the scale of thousands of GPUs, it is the pipeline that matters, not your hero scripts: tests that grow from one GPU to one server to one rack to the whole cluster, with logging, observability, and a written instruction at each step.
This guide is something I have been doing for a while, baptism by fire, and I have the scars to prove it: many sleepless nights, and more to come. The result is fulfilling when you see the infrastructure running the most powerful models on the planet. The intent here is to help you navigate the vocabulary, bring order to the chaos, and hand you the commands and the error lookup tables that run the pipeline on my two favourite GPU families, NVIDIA and AMD.
Table of Contents
- Why Brand New, Expensive Hardware Fails
- Tower of Babel: L10, L11, L12, East-West, North-South
- The Next-Gen Hardware Coming Your Way
- Planning the Burn-In
- Node Level: DCGM and the AMD Equivalents
- Fabric Level: East-West
- North-South and Storage
- Decrypting Errors: Xid and AMD RAS
- Ship It: Acceptance Criteria, Gates, and the Rack as a Unit
- Debugging Is a Real Science in AI Clusters
- The Ten Commandments: Commands to Run on Every New Node
- AI Agents: Automating the Loop
- What the Field Reports
- References
Why Brand New, Expensive Hardware Fails
If I had a dollar for every time someone in GPU infrastructure asked me this, I would have retired rich. Hardware does not fail at a constant rate over its lifetime. Reliability engineers draw the failure rate as a bathtub curve. On the left, the rate starts high and drops quickly. Those are the infant mortality failures (morbid terminology, but it means the hardware dies as soon as it leaves the factory), usually from a manufacturing defect: the famous NaN-producing H100s, a cold solder joint, a marginal memory cell. In the middle the rate is low and flat. On the right it climbs again as parts wear out. GPUs sit high on both ends of this curve because of how complex the hardware is.
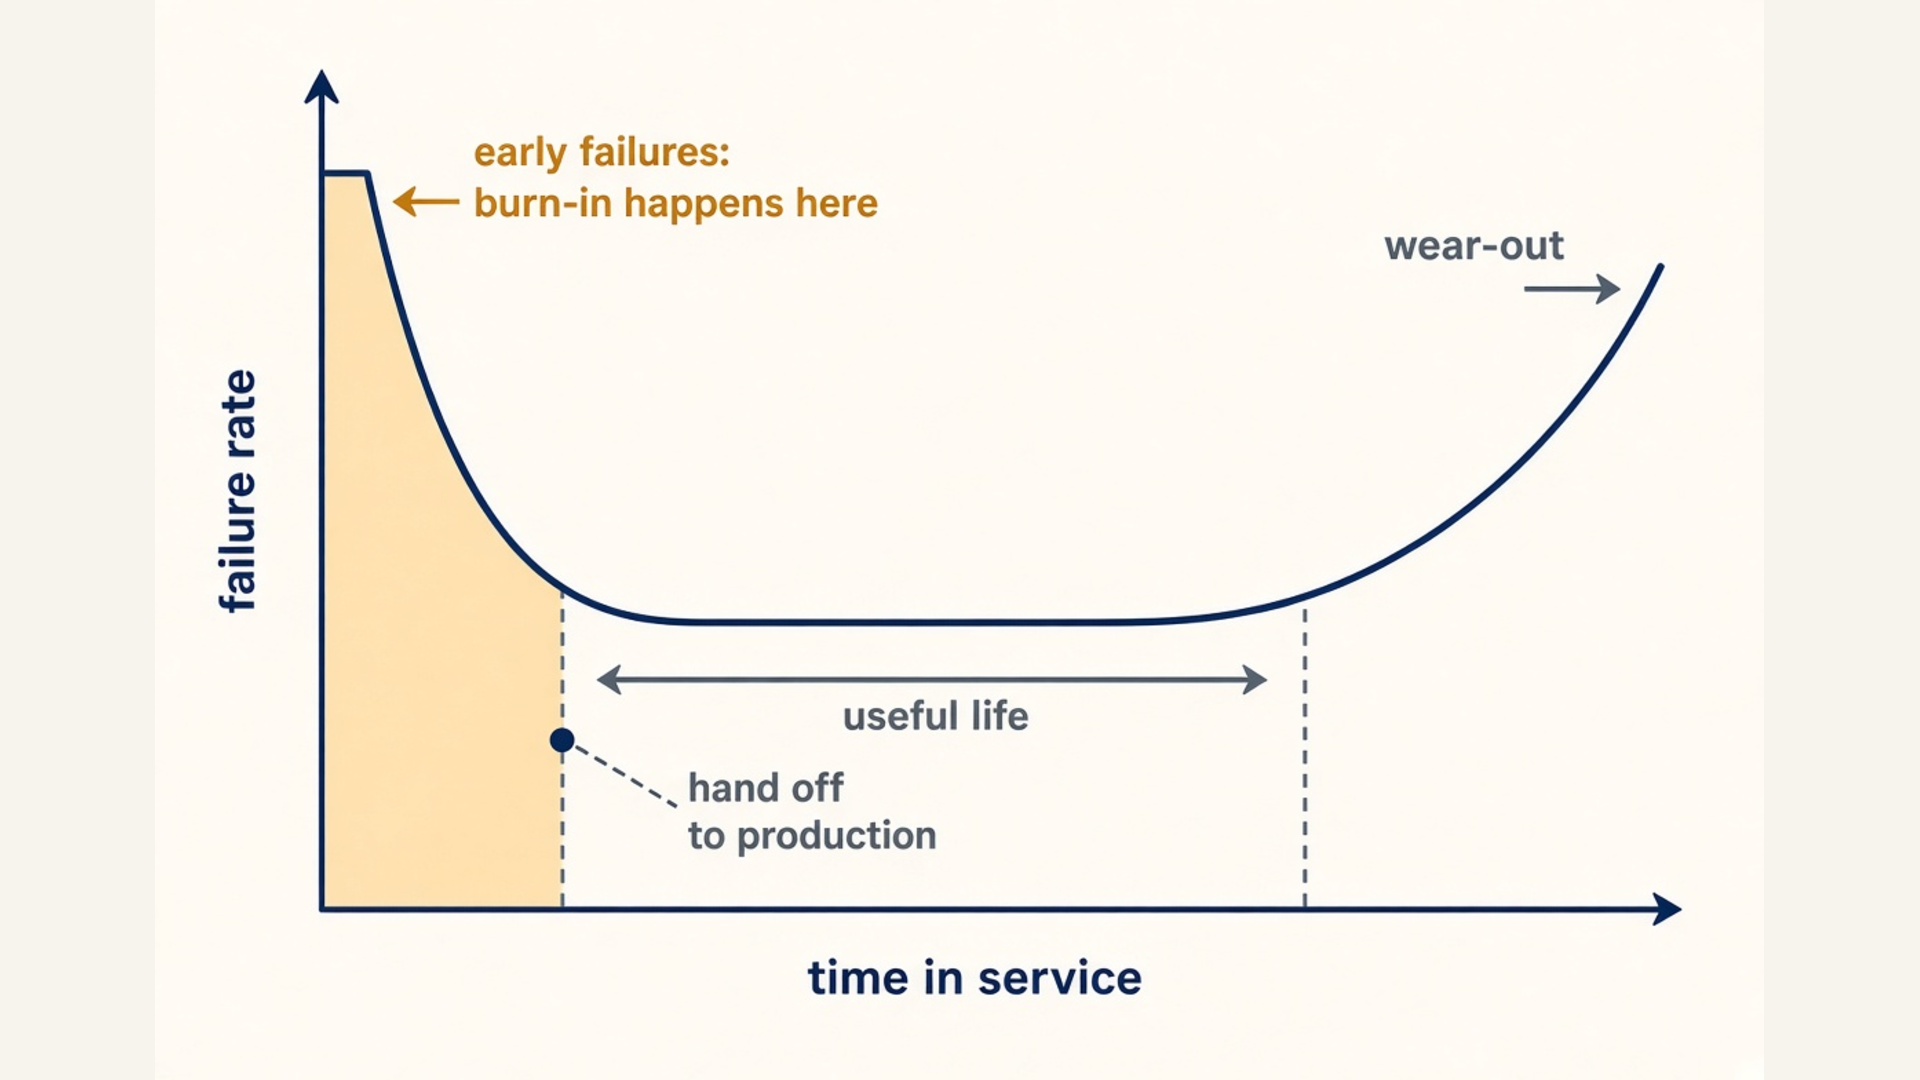
Burn-in is a wager on the shape of that curve. If you run the hardware hard for days before you release it to real workloads, most of the early failures happen on your clock, and your training job gets a much better chance of success. A GPU that dies in its first hours inside a burn-in environment is a repair ticket. The same GPU dying inside a training run is lost training time, which is far more expensive to recover.
Two factors make this matter more for AI clusters than for ordinary compute.
First, scale. If one GPU in a hundred has an early-life defect, a 256-GPU cluster has two or three of them on day one. Push that to 1,024 GPUs and you have ten. At 131,072 GPUs, the size of the largest clusters OCI runs, you have over a thousand bad parts before the first job starts. Meta measured this and published it. On the same cluster, jobs on 8 GPUs had a mean time to failure of about 48 days. Jobs on 1,024 GPUs failed about every 8 hours. The hardware did not get worse. There was simply more of it in each job, and the job stops whenever one piece stops. The domino effect.
Second, tight coupling. A training step is thousands of GPUs computing, then all waiting for each other, then computing again. Rinse and repeat. The job runs at the speed of the slowest member of that chain and comes to a full stop when the chain breaks. Translate that to a data center: a cable that drops packets does not cost you one GPU, it costs you the whole job. (OCI’s architects, brilliant folks, attack this at the network level with the multiplanar design. Watch Pradeep Vincent, OCI’s Chief Technical Architect, on the Oracle Acceleron multiplanar network. That is another deep dive and amazing technology.)
Fundamentally, in AI GPU clusters, we are not testing parts, we are testing a system. A single GPU can pass every test on its own and still ruin a cluster because someone’s stubby fingers failed to seat an optical cable properly. Optics and cables have been the bane of my life for the last two years. That is a different blog.
Tower of Babel: L10, L11, L12, East-West, North-South
The first time I heard “L10” and “L11” at the OCI offices, I thought I had joined the Secret Service and the acronyms were leading to some special mission. A brilliant architect from the Seattle office, who goes by the first name Sean, explained it as simply as this: they are rooted in how all manufacturing works.
The manufacturing levels
Server makers describe how far along the assembly line a product has been tested with the labels L6, L10, L11, and L12. The definitions vary by vendor and by contract. They are shorthand, not a standard. Roughly:
| Level | Unit under test | Who usually does it | What runs there | What you repeat on arrival |
|---|---|---|---|---|
| L6 | A motherboard in a chassis | The factory | Power-on test | Nothing; this is below your line of sight |
| L10 | One complete server | The server vendor | Full system and component tests, OS and firmware load, stress and burn-in of CPUs, GPUs, memory, power | Everything in the “node level” section below |
| L11 | A rack of servers, cabled, with switches | The vendor or an integrator | Rack assembly, cable networking, tested “as a working total solution at the rack … level” | The in-rack part of the “east-west” section |
| L12 | Several racks as one cluster | The integrator or you | Multi-rack networking, software load, validation, tuning | The cross-rack part of “east-west”, plus north-south and the soak |
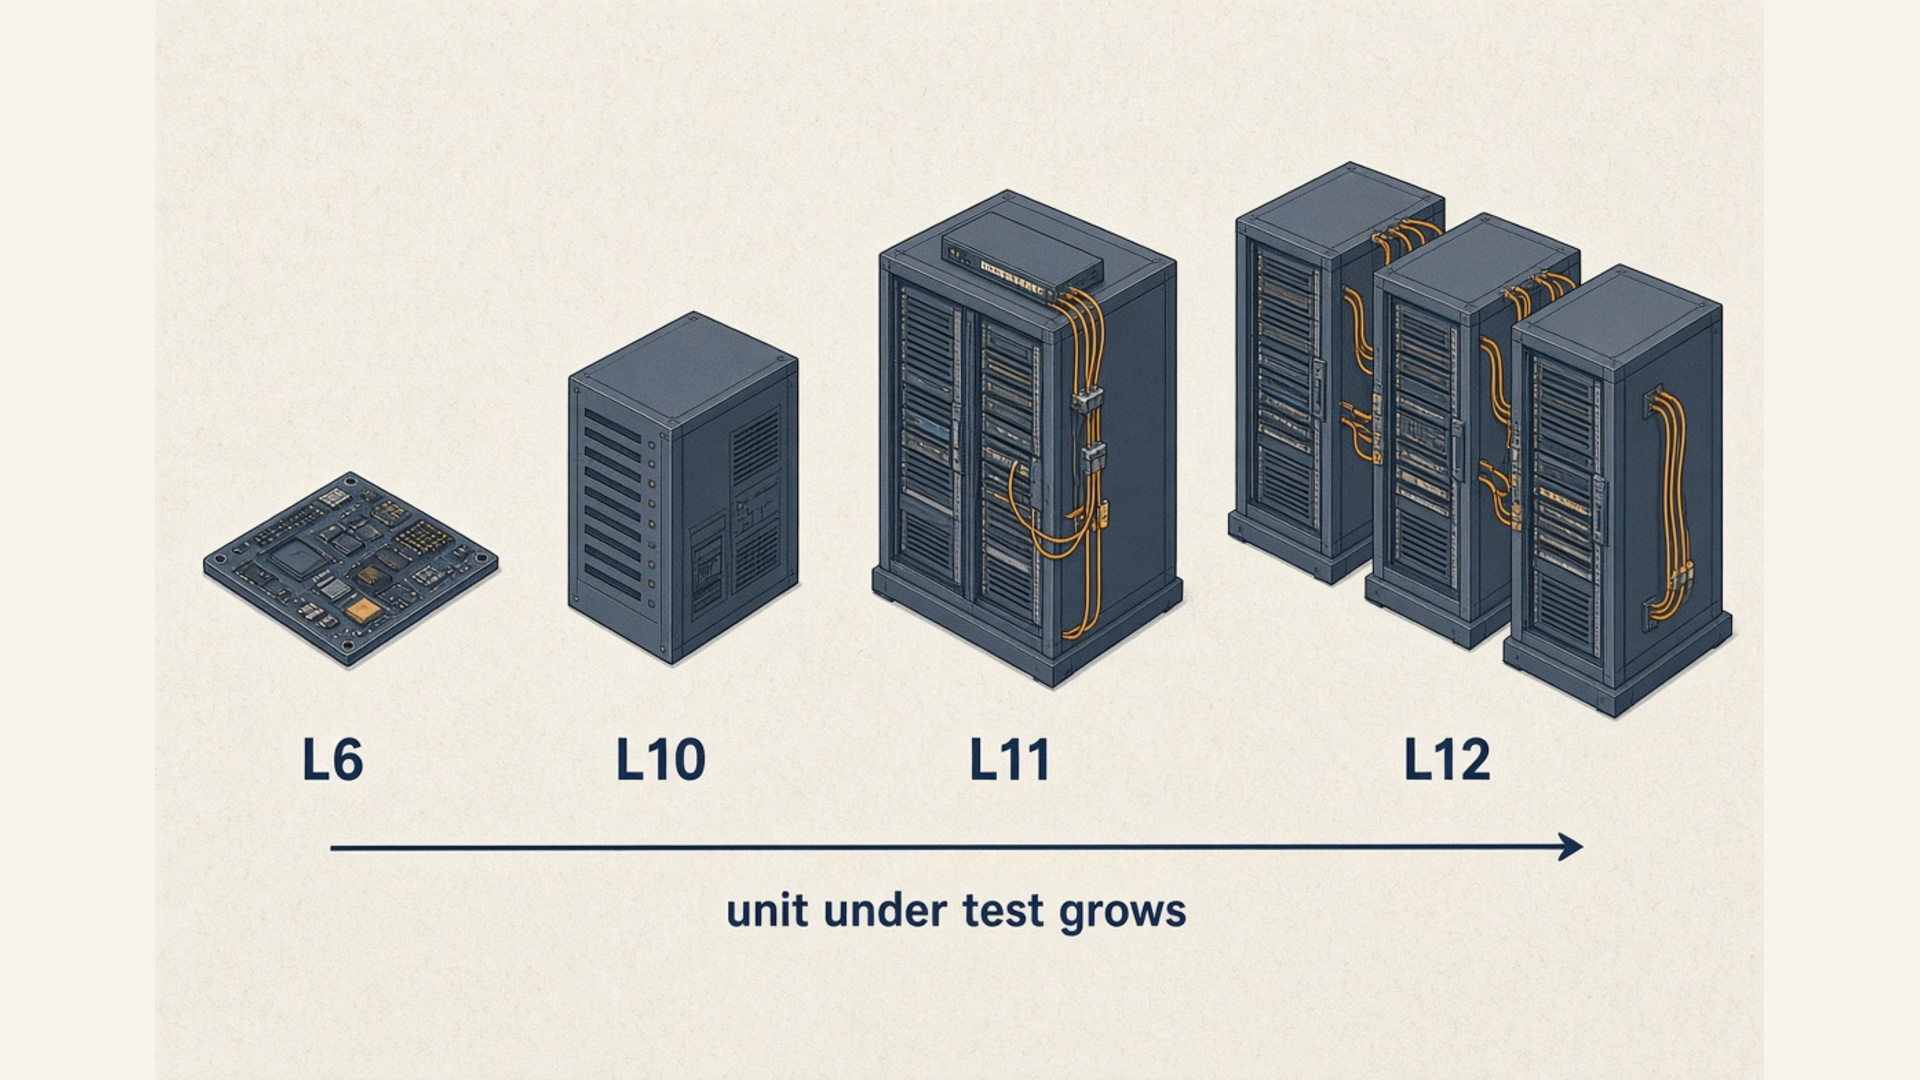
Rack-scale systems, where the unit of compute is no longer one server but a whole rack, change what a level means. In an NVIDIA GB200 NVL72 rack, 72 GPUs across 18 compute trays share one NVLink domain through 9 switch trays. A training job treats the rack as one big machine (NVIDIA calls it unified memory, delivered via IMEX; more on that below, and AMD has its own issues here). L10, the host level, cannot test this, because the NVLink switch layer only exists once the rack is assembled. This is where L11 comes in: the scale-up fabric, with the rack as the unit. OCI was a pioneer here with the first GB200 launch, which I was part of last year in Indonesia. On GB200 and GB300, every GPU-to-GPU path across the rack is tested through the NVLink switch, and real training and inference workloads run across the whole rack instead of component tests. AMD’s Helios will follow the same logic.
Whatever level the vendor sold you, repeat it in your own building. The truck ride and the reinstall can undo it.
Networking: three directions of traffic
Network people describe traffic by the direction it flows on a diagram. Burn-in tests each direction with different tools, so the words matter.
| Direction | What talks to what | Hardware that carries it | What breaks | First command |
|---|---|---|---|---|
| Inside the box | GPU to GPU in one server, GPU to CPU | NVLink and NVSwitch (NVIDIA), XGMI over Infinity Fabric (AMD), PCIe | A down NVLink, a PCIe link at the wrong width | nvidia-smi nvlink -s, amd-smi xgmi |
| East-west | GPU to GPU across servers and racks | The RDMA back-end fabric: InfiniBand, or RoCE (RDMA over Converged Ethernet) on ConnectX or Pensando NICs; NVLink across trays inside an NVL72 rack | A cable with rising bit errors, a flapping port, a slow pair | mlxlink, ib_write_bw, all_reduce_perf |
| North-south | Servers to storage, users, the control plane, and the BMC (baseboard management controller) | Front-end Ethernet NICs and DPUs, the out-of-band management network | Slow checkpoints, a node the scheduler cannot reach | iperf3, fio |
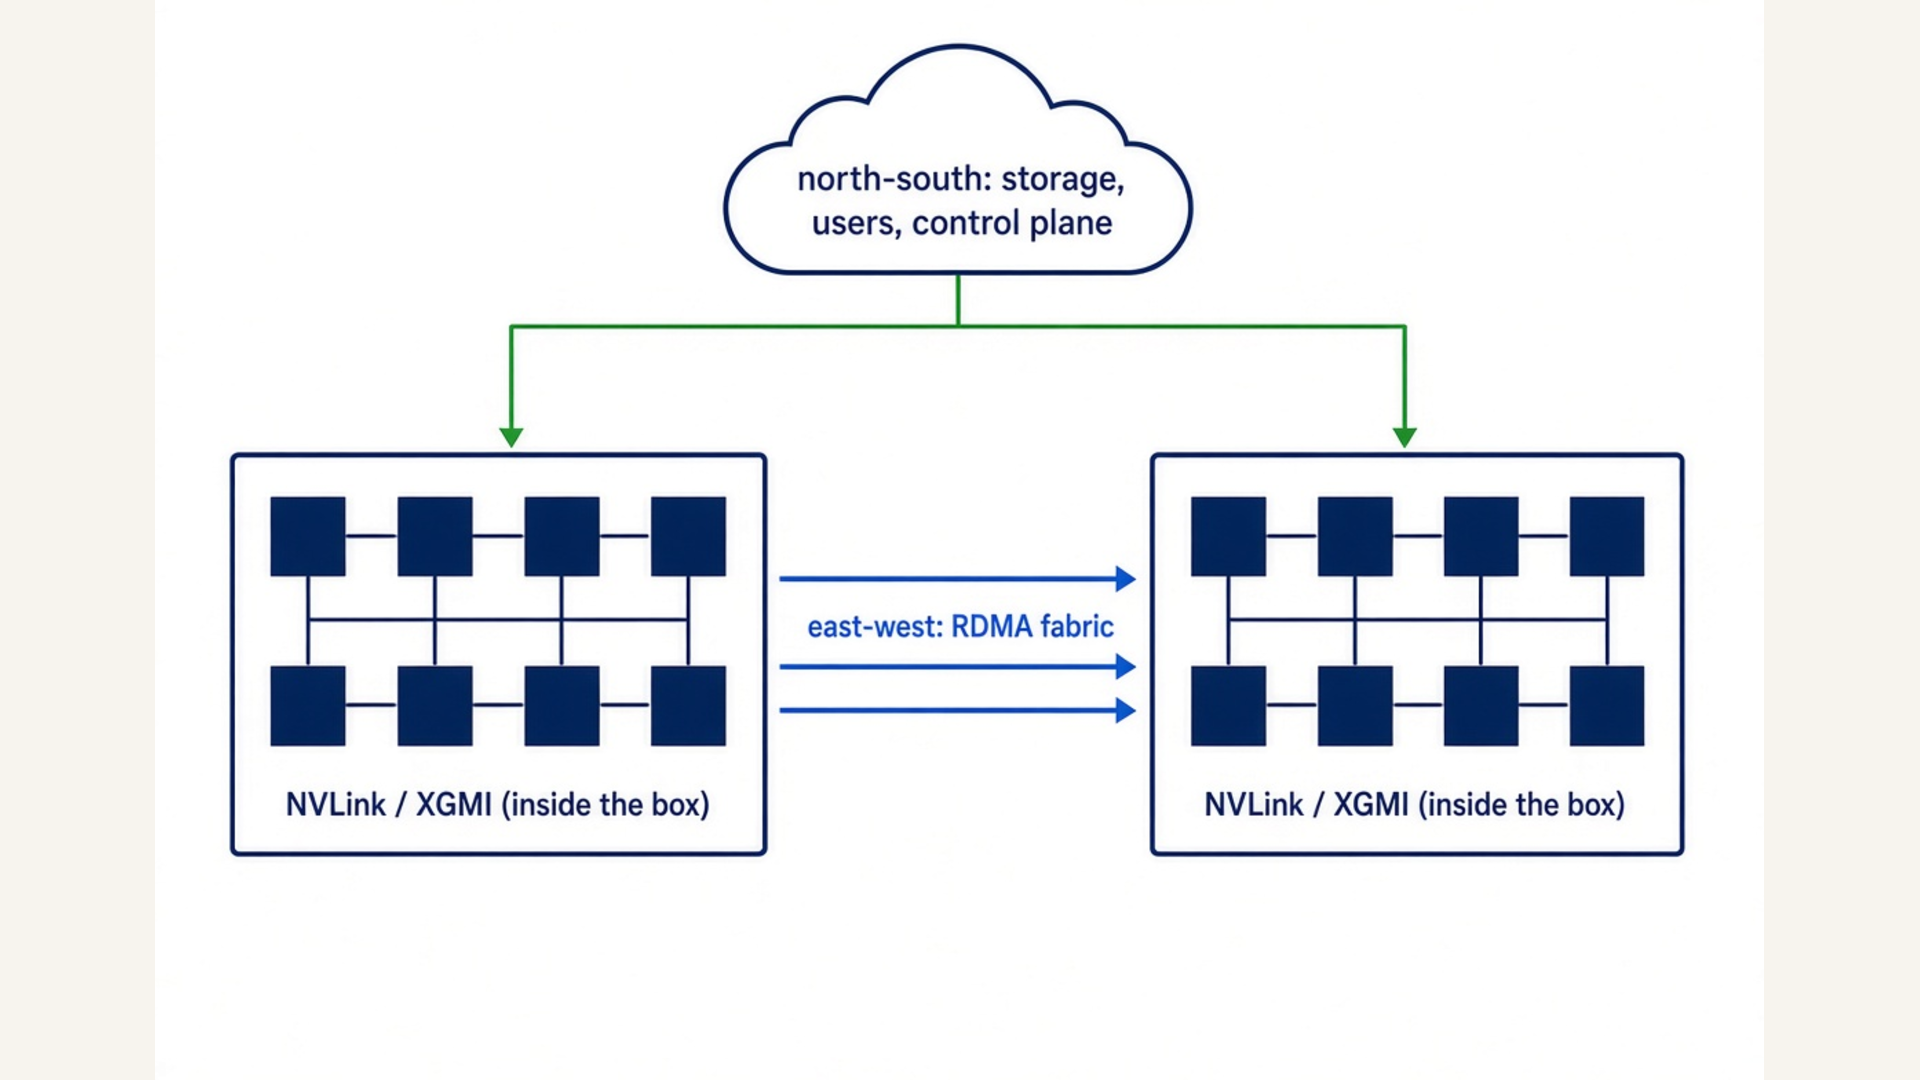
NVIDIA’s reference design splits the cluster network in two. The east-west side is an RDMA fabric built as leaf-spine with a rail-optimized layout, and it carries GPU-to-GPU traffic. The north-south side handles everything else: compute, storage, in-band management, and user access. OCI’s cluster network is a public example. It runs RoCE v2 on ConnectX NICs over a three-tier Clos fabric, gives each GPU 400 Gbps of nonblocking bandwidth, and relies on congestion control instead of priority flow control. Details like these tell you what numbers to expect and which counters to watch.
The majority of burn-in time goes to east-west. Do not skip north-south; you will regret it later. A cluster that computes fast but checkpoints slowly is a slow cluster, and it will give you headaches once you are debugging at scale.
The Next-Gen Hardware Coming Your Way
The unit you work with depends on the SKU and its reference architecture. For an 8-GPU server such as an NVIDIA H100 or an AMD MI300X, the server is the basic unit. For GB200, GB300, and AMD’s upcoming Helios, the 72-GPU rack is the fundamental unit.
NVIDIA
| SKU | Unit you test | Memory | Scale-up link | Status |
|---|---|---|---|---|
| H100 SXM | 8-GPU HGX server | 80 GB HBM3 per GPU | NVLink 900 GB/s per GPU | Shipping |
| H200 SXM | 8-GPU HGX server | 141 GB HBM3e per GPU | NVLink 900 GB/s per GPU | Shipping |
| HGX B200 | 8-GPU HGX server | 1.4 TB per 8 GPUs | NVLink 1.8 TB/s per GPU, fifth-gen NVSwitch | Shipping |
| GB200 NVL72 | 72-GPU liquid-cooled rack, 36 Grace CPUs | 13.4 TB HBM3e per rack | One 72-GPU NVLink domain, 130 TB/s | Shipping |
| HGX B300 / GB300 NVL72 | 8-GPU server / 72-GPU liquid-cooled rack | 2.1 TB per 8 GPUs / 20 TB per rack | NVLink 1.8 TB/s per GPU; 130 TB/s per rack; ConnectX-8 at 800 Gb/s per GPU | Shipping |
| Vera Rubin NVL72 | 72-GPU rack, 36 Vera CPUs | HBM4 | NVLink 6, 3.6 TB/s per GPU, 260 TB/s per rack; ConnectX-9 | Announced, partners H2 2026 |
AMD
| SKU | Unit you test | Memory | Scale-up link | Status |
|---|---|---|---|---|
| MI300X | 8-GPU OAM platform | 192 GB HBM3 per GPU, 5.3 TB/s | Infinity Fabric (XGMI) between the 8 GPUs | Shipping |
| MI325X | 8-GPU OAM platform | 256 GB HBM3E per GPU, 6.0 TB/s | Infinity Fabric | Shipping |
| MI355X | 8-GPU liquid-cooled OAM platform | 288 GB HBM3E per GPU, 8 TB/s | Infinity Fabric, 7 links per GPU | Shipping |
| MI455X / Helios | 72-GPU rack with EPYC “Venice” CPUs and Pensando NICs | HBM4 (432 GB per GPU reported) | UALink over Ethernet across the rack | Announced, shipments 2H 2026 |
Three things change as you move down each table. Liquid cooling adds a leak test and a flow check before any GPU is powered. I first saw this in OCI data centers in Utah and Indonesia, and it is impressive technology with a rigorous science behind it. A rack-scale NVLink or UALink domain adds a fabric verification step. And every NIC generation changes the expected RDMA bandwidth. OCI provides the fastest and latest. Your tests have to know the manufacturer’s limits for each SKU and hold the hardware to a healthy fraction of them; I use around 80 percent of theoretical as the floor for a first conversation, then tighten it from clean runs. OCI’s Dr.HPC, our pioneering test software, does this automatically per shape. (There is a story behind every piece of software. Dr.HPC was named after Dr. House, the TV doctor who could find the problem nobody else could. It is your doctor for HPC and GPU hosts.)
Planning the Burn-In
A bad burn-in plan is “run something heavy for 48 hours and pray to Jesus that nothing breaks.” When it finishes you cannot say what was tested, and when it fails you cannot say where. A sure path to hell. A good plan has a trinity of good basics.
Freeze the configuration first. For every node, record serial numbers, firmware on every component, the OS image, kernel, driver, CUDA or ROCm, NCCL or RCCL, container digest, and the version of every test tool. Most teams turn this into a golden settings script that refuses to start stress tests until every node matches. Firmware drift is one of the most common findings in a new cluster. A replaced GPU often arrives with older firmware than the one it replaced.
# Golden settings snapshot, NVIDIA
nvidia-smi --query-gpu=name,serial,driver_version,vbios_version,pcie.link.gen.current,pcie.link.width.current --format=csv
nvidia-smi nvlink -s
nvidia-smi topo -m                      # the GPU / NIC / NUMA map you expect for this SKU
ibstat | grep -E "CA '|State|Rate|Physical"

# Golden settings snapshot, AMD
amd-smi list
amd-smi static -b -d
amd-smi xgmi
rocm-smi --showtopo
Test in layers, from the inside out. Each phase has a small set of possible causes, so a failure points somewhere specific.
| Phase | Scope | NVIDIA tools | AMD tools | Evidence to save |
|---|---|---|---|---|
| 0 | Inventory and configuration | nvidia-smi, lspci, ibstat | amd-smi, lspci | The golden settings output |
| 1 | One node, no network | dcgmi diag, gpu_burn | rvs, AGFHC | Diag JSON, telemetry during stress |
| 2 | Links inside the node | nvbandwidth, single-node all_reduce_perf | TransferBench, single-node all_reduce_perf (rccl-tests) | Bandwidth tables |
| 3 | Node pairs and leaf groups | mlxlink, ib_write_bw, two-node all_reduce_perf | Same tools | Link counters before and after, per-pair busbw |
| 4 | Whole cluster | Cluster-wide all_reduce_perf | Same | busbw at large sizes, any node bisected out |
| 5 | Soak with a real workload | A training job with checkpoints | Same | Throughput, temperatures, clocks, interruptions |
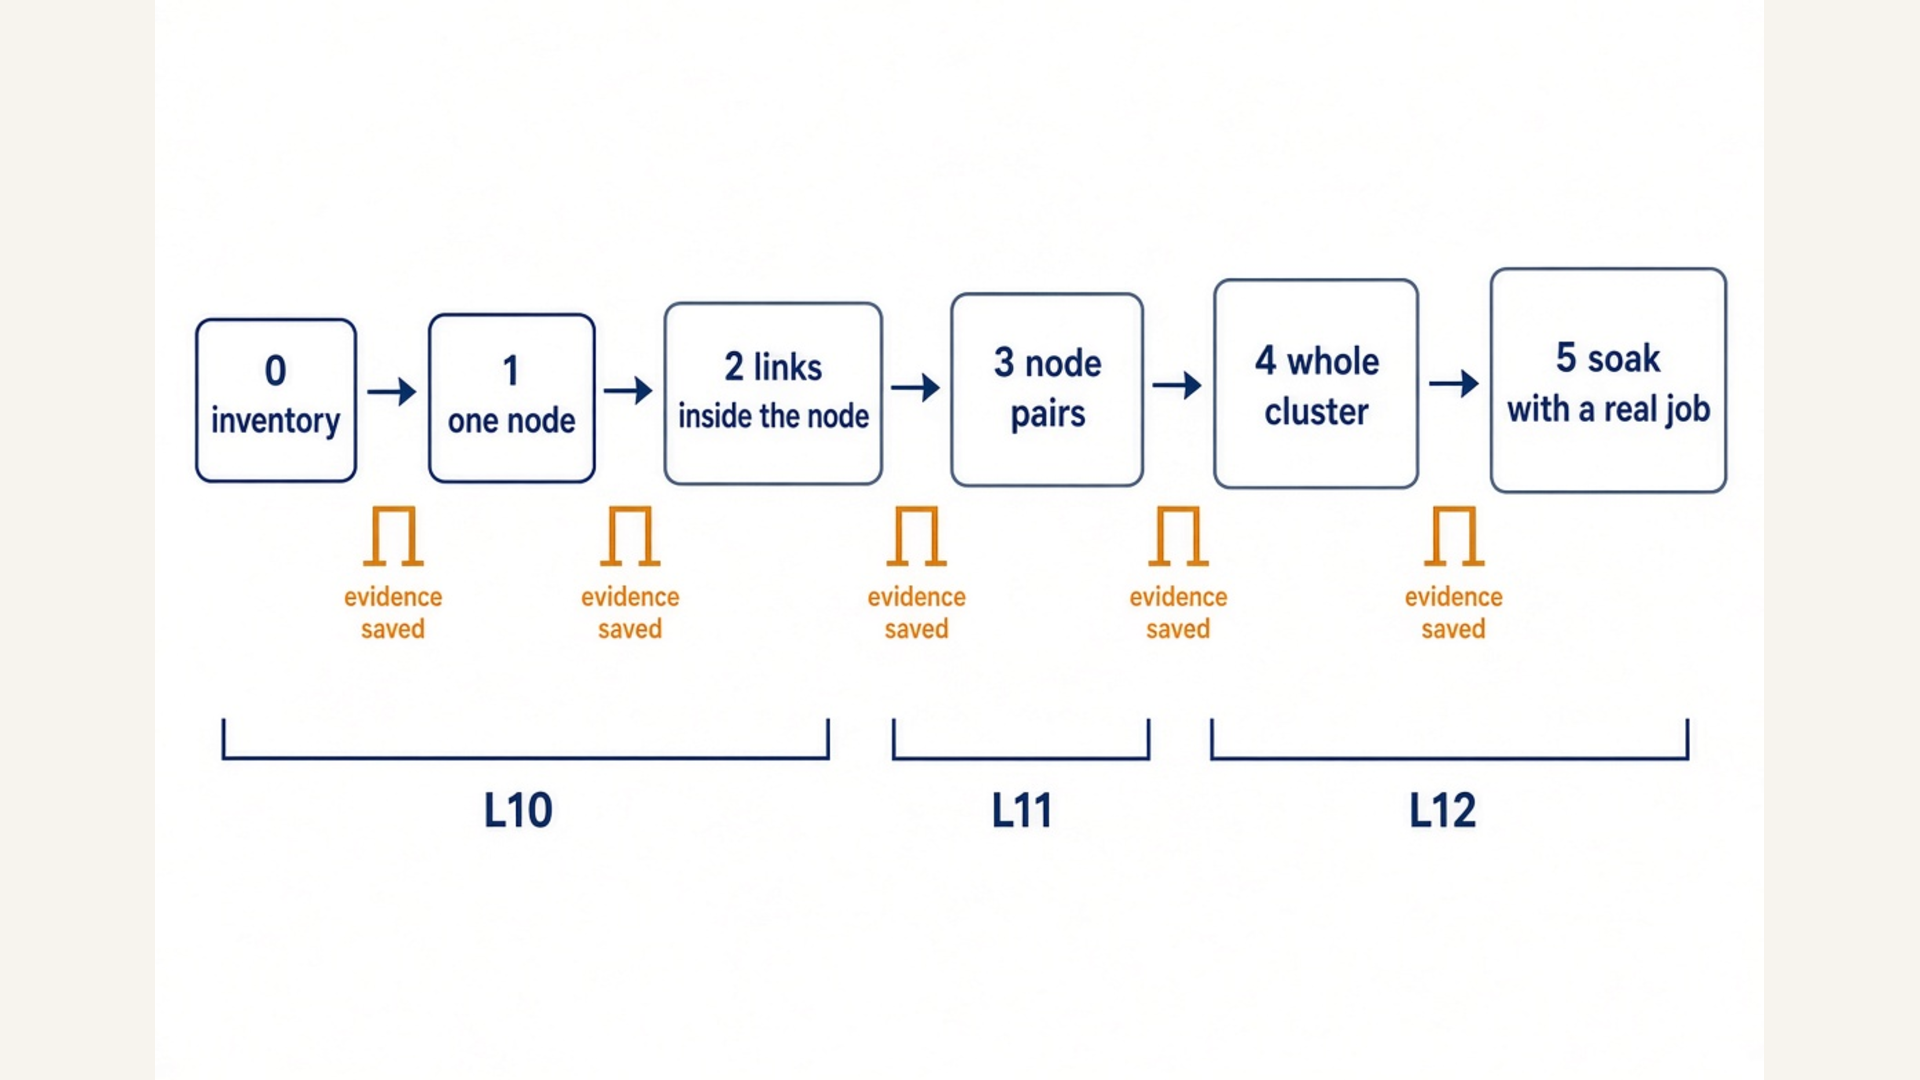
Phases 0 to 2 are what a good L10 delivers. Phases 3 and 4 inside one rack are L11. Everything across racks is L12.
Measure change, not state. Snapshot memory errors, remapped rows, PCIe replays, NVLink and NIC errors, link flaps, temperatures, and throttle reasons before each phase, and again after. A GPU with 50 corrected errors from the factory is not news. A GPU that gains 50 during a four-hour run is news. The delta is the evidence.
Decide the stop conditions before you start: a GPU or link disappears, an uncorrectable memory error, a wrong answer from a collective, a temperature alarm. When a stop happens, save the logs and counters before anyone resets anything. A reset clears the evidence. And there is no magic number of hours. A soak that fails at hour 20, gets a node swapped, and then runs clean for two hours is a two-hour soak.
Node Level: DCGM and the AMD Equivalents
DCGM, the NVIDIA Data Center GPU Manager, is the standard tool for asking an NVIDIA GPU whether it is healthy. Its dcgmi diag command runs tests in four levels. Each level includes everything below it. Times are NVIDIA’s stated maximums for an 8-GPU system.
| Level | Command | What it adds | Time |
|---|---|---|---|
| 1 | dcgmi diag -r 1 | Software, PCIe, memory checks | under 2.5 seconds |
| 2 | dcgmi diag -r 2 | Memory bandwidth, diagnostic | under 10.5 minutes |
| 3 | dcgmi diag -r 3 | Targeted stress, targeted power, nvbandwidth, NCCL test | under 35 minutes |
| 4 | dcgmi diag -r 4 | Memory pattern test, pulse test | under 2.25 hours |
Level 1 runs on every boot. Level 2 is the gate after any driver or firmware change. Level 3 is the standard burn-in test: long enough to heat the GPU up and hold it there, and it checks the answers of the math it runs. Level 4 is for first commissioning and for a GPU you suspect but cannot prove.
# Level 3 with the flags that matter: stop at first failure, write JSON
dcgmi diag -r 3 --fail-early -j > node01_diag.json

# Retest only GPUs 0 and 1 after a repair
dcgmi diag -r 3 -i 0,1 -j

# Hold the stress phase longer (seconds) when you want more heat
dcgmi diag -r 3 -p diagnostic.test_duration=600 -j

# Watch while it runs; every GPU should sit near rated power at a stable clock
nvidia-smi --query-gpu=index,temperature.gpu,clocks.sm,power.draw,clocks_event_reasons.active --format=csv -l 5

# Plain compute stress, ten minutes
./gpu_burn 600
Three rules for reading the result. A skip is not a pass; a skipped test was never run. Read the reason: a GPU that failed because it throttled is a cooling problem, and swapping the GPU will not fix it. Know the tool’s limit: NVIDIA says DCGM is “not designed to replace the field diagnosis tools”. When a GPU fails DCGM twice, stop retesting and open the vendor’s field diagnostic process.
AMD Instinct systems have the same layers with different names. amd-smi plays the role of nvidia-smi. The ROCm Validation Suite (rvs) runs stress, power, PCIe, and memory tests from config files, with GPU-specific configs you should always prefer. The AMD GPU Field Health Check (AGFHC) has levels of increasing length, from all_lvl1 at about five minutes to all_burnin_24h. AGFHC is not on GitHub; AMD’s docs say to “contact your AMD representative to complete the authorization process”.
# Idle sanity: utilization near zero, temperature well under 85 C
amd-smi monitor -putm

# GPU stress with the MI300X-specific config
rvs -c /opt/rocm/share/rocm-validation-suite/conf/MI300X/gst_single.conf

# Or run a module by name
rvs -m gst
Fabric Level: East-West
A training job spends much of its time in collective operations. NCCL on NVIDIA and RCCL on AMD run them, and nccl-tests and rccl-tests measure them. all_reduce_perf is the one everyone starts with. For every flag and environment variable, see the NCCL guide linked at the end.
Know which path you are testing
Traffic between GPUs in the same server goes over NVLink or XGMI. Traffic between servers goes over the RDMA network. A rack-scale system adds a third case: NVLink across trays. Run inside one node first, so the number you get is the NVLink number. Then across two nodes, so the number is the network number.
# Inside the box: copy bandwidth over every GPU pair
./nvbandwidth -t device_to_device_memcpy_write_ce

# NVLink state and error counters (take a before and an after)
nvidia-smi nvlink -s
nvidia-smi nvlink -e

# NVL72 only: the whole rack must agree on the fabric
nvidia-smi -q | grep 'Fabric' -A 4      # expect State: Completed, Status: Success
nvidia-smi topo -p2p n                  # expect OK for every GPU pair
systemctl status nvidia-fabricmanager

# AMD: XGMI link table
amd-smi xgmi

# Single-node all-reduce sweep with correctness checking
mpirun -np 8 ./build/all_reduce_perf -b 8 -e 8G -f 2 -g 1 -c 1
IMEX: the piece that makes a rack one machine
On GB200 and GB300 NVL72, a GPU in one compute tray can read and write memory in another tray over NVLink. The service that brokers those cross-node memory mappings is IMEX, the NVIDIA Internode Memory Exchange. If IMEX is unhealthy, the fabric can look fine and the collective still fails or hangs across trays. Check it on every node in the rack. I verified the commands below on a GB200 and a GB300 tray running IMEX 580.126.20; the tool has no -h, so use --help.
# The fabric first: every node in the rack must show the same ClusterUUID and CliqueId
nvidia-smi -q | grep -A 4 '^    Fabric'   # State: Completed, Status: Success, CliqueId, ClusterUUID

# Service state on this node. Fresh images ship it disabled with no node list; you add both.
systemctl status nvidia-imex
ls /etc/nvidia-imex/                       # config.cfg always; nodes_config.cfg once the domain is defined
grep -E '^(IMEX_NODE_CONFIG_FILE|LOG_FILE_NAME|SERVER_PORT|IMEX_CMD_PORT|NETWORK_INTERFACE)' /etc/nvidia-imex/config.cfg

# Ask the local daemon (needs the daemon running; talks to port 50005)
nvidia-imex-ctl -q

# Whole-domain status; needs config.cfg and nodes_config.cfg on this node
nvidia-imex-ctl -N                         # add -j for JSON, -H to show hostnames next to IPs
nvidia-imex-ctl -n                         # same, but keeps watching

# Logs: the healthy line is "GPU event successfully subscribed"
grep -E "successfully subscribed|TRANSIENT_FAILURE|Not all clients connected" /var/log/nvidia-imex.log
journalctl -u nvidia-imex --since "1 hour ago"
What good looks like: every node in the domain is up, nodes_config.cfg is identical on every host, nvidia-imex-ctl -q answers, and the log shows GPU event successfully subscribed. What bad looks like: Failed to read node configuration file (the node list was never written), Query Status returned error code: 14 (the daemon is not running on this node), State = TRANSIENT_FAILURE (NOT OK) or Not all clients connected. Waiting and retrying. (the domain is not fully formed). NVIDIA’s fix for the last two is to restart the nvidia-imex service on all compute nodes so the domain rebuilds, after you have confirmed the fabric state is Completed on every node. IMEX will not save a rack whose NVLink fabric is broken; it only sits on top of it.
There is no AMD equivalent to IMEX yet. Shipping AMD platforms (MI300X, MI325X, MI355X) have no cross-node memory fabric; the scale-up domain ends at the 8 GPUs joined by XGMI inside the box, so the checks are amd-smi xgmi and rocm-smi --showtopo. Across nodes it is RDMA, tested with the same tools as everyone else. When Helios arrives with UALink across 72 GPUs, expect AMD to publish a rack-level fabric service and the tooling to match; it is not public at the time of writing.
Check link health before you measure bandwidth
A bandwidth number from a link that is retransmitting is a number you cannot trust. On ConnectX NICs, mlxlink shows the physical layer: speed, forward error correction (FEC) state, raw and effective bit error rate (BER), and a histogram of how many bits each FEC block had to correct. In my experience, raw errors that FEC corrects are usually benign. Effective errors, the ones that got through, are the problem and should be zero. Run it on both ends of every link, before and after each test, and keep the counters per port. A node with several NICs can lose one path and still post a reasonable aggregate number.
# Map RDMA devices to network interfaces, then check port state and rate
ibdev2netdev
ibstat | grep -E "CA '|State|Rate|Physical"
rdma link                               # expect ACTIVE and LINK_UP on every RDMA port

# Physical layer: module info, counters and BER, eye opening
mlxlink -d mlx5_0 -m -c -e

# FEC histogram: bins with many corrected bits mean a marginal cable
mlxlink -d mlx5_0 --rx_fec_histogram --show_histogram

# The NIC's own PCIe link and error counters
mlxlink -d mlx5_0 --port_type PCIE -c

# RoCE only: receive discards should not grow (counter names vary by driver)
ethtool -S eth0 | grep -i discard
Measure pairs, then groups, then everything
# Pairwise RDMA bandwidth, same options on both ends (perftest)
ib_write_bw -d mlx5_0 -x 3 -s 65536 -D 60 -q 16 --report_gbits            # server
ib_write_bw -d mlx5_0 -x 3 -s 65536 -D 60 -q 16 --report_gbits 10.0.0.2   # client

# Same test, GPU memory to GPU memory (GPUDirect RDMA); pick the GPU nearest the NIC
ib_write_bw -d mlx5_0 -x 3 -s 65536 -D 60 -q 16 --report_gbits --use_cuda=0            # server
ib_write_bw -d mlx5_0 -x 3 -s 65536 -D 60 -q 16 --report_gbits --use_cuda=0 10.0.0.2   # client

# Latency, small message
ib_write_lat -d mlx5_0 -x 3 -s 8 -n 10000            # server
ib_write_lat -d mlx5_0 -x 3 -s 8 -n 10000 10.0.0.2   # client

# Two-node all-reduce, one large size held for many iterations
mpirun -np 16 -N 8 -H node01,node02 ./build/all_reduce_perf -b 1G -e 1G -n 10000 -c 1 -g 1
What numbers to expect
People ask me “what is a good number?” more than any other question. Start from the line rate, convert bits to bytes (divide by 8), then expect a healthy link to deliver most of it. These are public figures.
| What you are measuring | Line rate | What a healthy result looks like | Where the number comes from |
|---|---|---|---|
One 200 Gb/s NIC port, ib_write_bw | 25 GB/s | about 23 to 24.5 GB/s | line rate minus protocol overhead |
One 400 Gb/s NIC port, ib_write_bw | 50 GB/s | about 46 to 49 GB/s; OCI’s public H100 benchmark peaked at 48.9 GB/s | OCI Zettascale benchmark post |
One 400 Gb/s NIC port, bidirectional (-b) | 100 GB/s | AMD’s acceptance guide requires at least 770 Gb/s (96 GB/s) | AMD Instinct acceptance guide |
| GPU memory to NIC, one 400 Gb/s port | 50 GB/s | AMD’s guide requires at least 390 Gb/s (49 GB/s) | AMD Instinct acceptance guide |
| Per node, 8 x 400 Gb/s (H200, B200, MI300X, MI355X shapes) | 3,200 Gb/s = 400 GB/s | all eight ports within a few percent of each other | OCI Compute Shapes page |
| Per node, 8 x 800 Gb/s (B300 shape) | 6,400 Gb/s = 800 GB/s | same rule, new baseline | OCI Compute Shapes page |
| Single-node all-reduce busbw, 8 x H100 | NVLink 900 GB/s per GPU | OCI measured 476 GB/s at large sizes | OCI Zettascale benchmark post |
| Two-node all-reduce busbw, 16 x H100 over RoCE | 8 x 400 Gb/s per node | OCI measured 470 GB/s; a nonblocking fabric should stay close to the single-node number | OCI Zettascale benchmark post |
| Single-node all-reduce busbw, 8 x MI300X | XGMI | AMD requires at least 304 GB/s at 8 GB messages | AMD Instinct acceptance guide |
| RDMA latency, CPU to CPU, small message | about 2.7 microseconds on OCI’s fabric | OCI Zettascale benchmark post |
Three rules of thumb from those numbers. A pairwise RDMA test should land within about 5 percent of line rate; if it is 20 percent low, the link is retransmitting or the NIC’s PCIe link is degraded. A two-node NCCL busbw within 10 percent of the single-node busbw means the network is not the bottleneck. And every pair on the same leaf switch should match within a few percent; the outlier is your suspect.
The output has two bandwidth columns. algbw is message size divided by time. busbw corrects for how much data the collective actually moves, so it lines up with the spec sheet: for all-reduce, busbw = algbw * 2(n-1)/n. Use busbw at big message sizes, where the curve flattens. The #wrong column must be zero on every line. Fast and wrong is worse than slow.
A low result across the whole cluster says something is broken. It does not say what. Start small instead. Two nodes on the same switch should give the same number, give or take a few percent. If a pair is low, the fault is in one of those nodes or the link between them. Swap in a good node and you will see which. On a big cluster, cut the nodes in half, keep the slow half, and repeat. Microsoft’s team used this to find one slow node in a 1,024-GPU run.
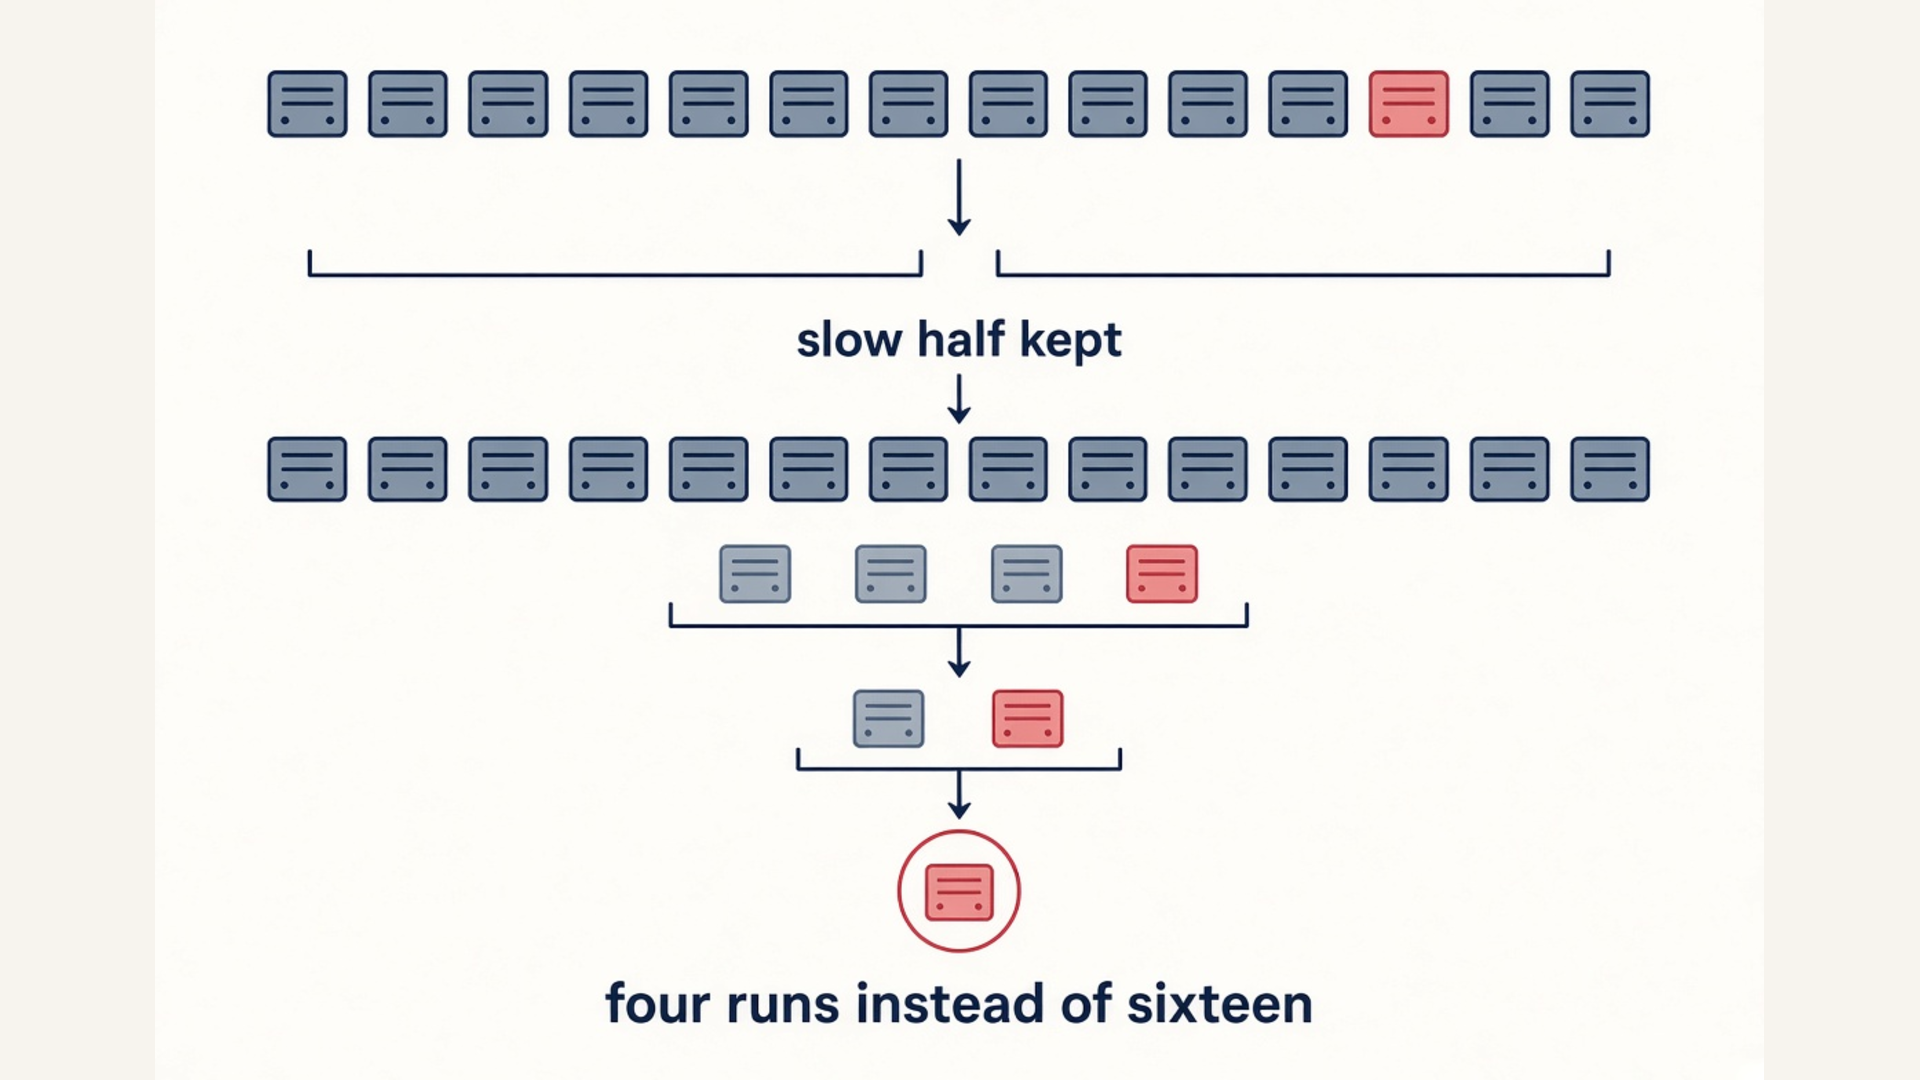
Two habits keep this honest. One low number means rerun, not ticket. And blame the right host. A good node can look bad because its partner is broken.
North-South and Storage
Storage is often understated. Every infrastructure engineer needs to test the storage path at the bandwidth a real checkpoint needs, from a GPU node, not from the login node. Then check the front-end network the same way.
# TCP throughput from a GPU node to the storage or front-end target
iperf3 -s                               # on the target
iperf3 -c storage01 -P 8 -t 30          # on the GPU node

# Checkpoint-shaped write: large sequential blocks, direct I/O, several writers
fio --name=ckpt --directory=/mnt/ckpt --rw=write --bs=1M --size=10G --numjobs=8 --direct=1 --group_reporting

# And the read back, because a restore is a read
fio --name=restore --directory=/mnt/ckpt --rw=read --bs=1M --size=10G --numjobs=8 --direct=1 --group_reporting
Compare the result with the theoretical bandwidth the storage was designed for. If the east-west tests were perfect and the job still stalls at checkpoint time, you have found your bottleneck.
Decrypting Errors: Xid and AMD RAS
An Xid is an error report from the NVIDIA driver in the kernel log. It looks like NVRM: Xid (0000:03:00): 79, .... An Xid number is not a diagnosis by itself. The NVIDIA catalog is the source of truth, because meanings and actions differ by product and driver. This short list is for orientation.
grep -i 'NVRM: Xid' /var/log/syslog
dmesg -T | grep -i xid

# Which GPU? The line before the Xid names the bus id and UUID
dmesg -T | grep -B1 -i xid | grep "GPU at"
| Xid | NVIDIA’s description | Class | Burn-in action |
|---|---|---|---|
| 13 | Graphics engine exception, “typically … an out-of-bounds error” | Application | Check the test binary first, not the GPU |
| 31 | GPU memory page fault reported by the MMU | Application, unless it repeats across jobs | Rerun; investigate if it follows the GPU |
| 48 | Double bit ECC error, “an uncorrectable error occurs on the GPU” | Memory | Stop, preserve counters, GPU fails |
| 63 | GPU memory remapping event | Memory | Record it; a reboot completes a pending remap |
| 64 | GPU memory remapping failure | Memory, blocking | Drain the node, GPU goes to the vendor process |
| 74 | NVLink error, “connection from the GPU to another GPU or NVSwitch” | Interconnect | Check nvlink -e on both ends; on NVL72 check the switch tray |
| 79 | “GPU has fallen off the bus”, not reachable over PCIe | Platform | Check the PCIe path and power, not just the GPU |
| 94 / 95 | Contained / uncontained memory error | Memory | 94: restart the app. 95: reset the GPU, then investigate |
| 119 / 120 | GSP (GPU System Processor) RPC timeout / error | Firmware or GPU | Reset, rerun; repeat means hardware |
| 154 | “GPU Recovery Action Changed”, a summary of another Xid | Summary | Keep the initiating Xid as well |
Two codes have tripped me up more than once. Xid 54 is auxiliary power, and applies to A100, H100 and B100, not GB200. Xid 64 is a remapping failure and is a blocking memory-health condition.
AMD Instinct GPUs do not emit Xids. AMD exposes RAS (reliability, availability, serviceability) data through amd-smi.
| Signal | Command | What it means | Burn-in action |
|---|---|---|---|
| Correctable ECC total | amd-smi metric -e | Errors the hardware fixed | Track the delta; growth during stress is the finding |
| Uncorrectable or deferred ECC | amd-smi metric -e | Errors that were not fixed | Stop, preserve, GPU fails |
| ECC by block (UMC, GFX, SDMA, PCIE_BIF, …) | amd-smi metric -k | Which part of the chip is erring | Points at memory vs fabric vs PCIe |
| Retired pages | amd-smi bad-pages | Memory the driver took out of service | Growth is the finding |
| Platform error records | amd-smi ras --cper | Timestamped records with severity | Save them with the run |
| Throttle violations | amd-smi metric -v | Power or thermal limits hit | Treat as cooling until proven otherwise |
Ship It: Acceptance Criteria, Gates, and the Rack as a Unit
One number by itself does not mean much. A number next to the one you expected means a lot. If you run the same test on 256 GPUs, you get 256 results. Save every one of them. Also note the middle value, how spread out they are, and which ones look odd. Six months later, someone will say training feels slower than before. The only good answer to “slower than what?” is the numbers you saved on the first day.
Decide what a pass looks like before you run any test. Write down three things: which test, what score it has to beat, and what you will do if it fails. Get those target scores from two places: the maker’s spec sheet, and your own first clean runs. Do this for each type of hardware and each size of cluster.
| Check | Criterion | On failure |
|---|---|---|
| GPU and NIC count | Exactly the number in the shape definition, on every boot | Node fails, physical inspection |
| PCIe links | Every GPU and NIC at the rated generation and width | Node fails, reseat then replace |
| DCGM level 3 or AGFHC | All tests pass, no unexpected skips, no throttling during stress | Rerun once; second failure opens a hardware ticket |
| Corrected memory errors | No growth during a stress run beyond the vendor’s limit | Watch list, rerun level 4 |
| Uncorrected memory error | None, ever | Node fails, GPU replaced |
| Single-node all-reduce | busbw at large sizes within a few percent of the NVLink or XGMI baseline | Node fails, check links and topology |
| Two-node all-reduce | busbw near the network’s expected value for the SKU | Rerun; then check the pair’s cables and ports |
| RDMA link errors | No link flaps and no effective error growth over the soak | Cable or transceiver replaced |
| Soak | Agreed hours uninterrupted, checkpoints written and restored | Restart the soak clock after any repair |
Three rules for what happens next. Repeat before you replace. The supply chain will hurt you if you keep swapping parts on one failure. Run the test again first. Only when the same test fails twice on the same path do you touch the hardware. A setup problem is not a hardware problem. If the container never downloaded, nothing got tested. Write “unassessed” in the record, not “pass”. Do not throw out a failed node. Put it in a holding pool with the evidence of what went wrong. To come back, it has to pass the same gates as everyone else, including every test that comes after the one it failed.
The whole path has six gates, in this order: facilities, configuration, node and local fabric, network, storage and application, and closure. Closure means every node in the holding pool is either fixed and retested, or has a written exception with an end date. Then you hand the record to the operations team.
With rack-scale systems, the rack is the unit you test. In a GB200 NVL72 rack, every GPU has to reach every other GPU over NVLink. The fabric manager, the switch trays, and IMEX have to agree on how the rack is wired. And the acceptance test is a real workload run across the whole rack. If one tray is sick, the whole rack slows down. AMD’s Helios works the same way, with UALink instead of NVLink. Plan ahead so you can swap one bad tray without shutting down the rest of the rack.
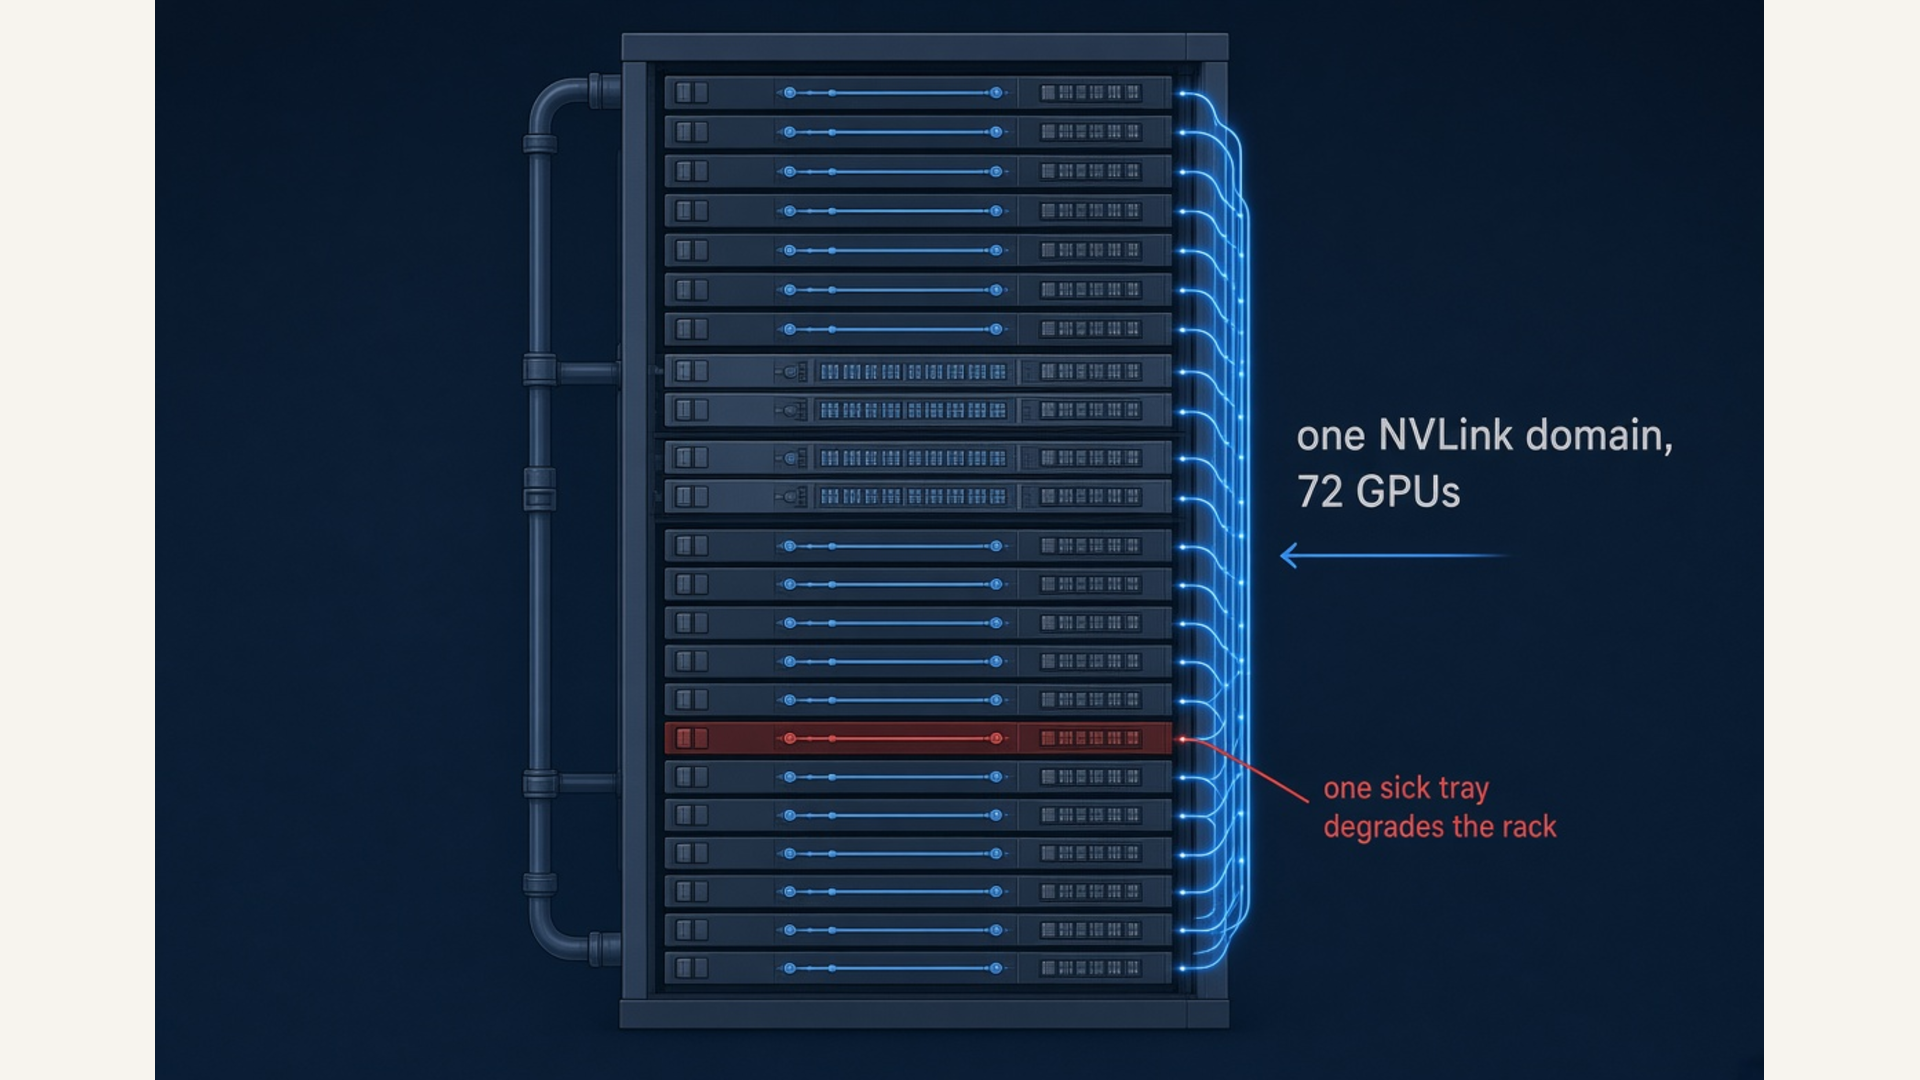
Burn-in is day zero. But the same checks keep running once the cluster is in use. OCI has published how it does this. There are passive checks: GPU count, PCIe speed and width, whether RDMA links are up and how often they drop, receive discards, ECC and row-remap counters, clock speeds and throttling. And there are active checks: DCGM diagnostics, a GPU stress run, and an NCCL or RCCL all-reduce. These run as scheduled jobs on nodes that are sitting idle, at most once a day per node, and each node gets marked pass or fail. It is the same commissioning pipeline, made small enough to live inside a working cluster.
Debugging Is a Real Science in AI Clusters
Scenario 1: A GPU is missing after boot
# Step 1: count what the bus sees vs what the shape says
lspci | grep -ci nvidia
nvidia-smi -L

# Step 2: look for Xid 79 (fallen off the bus)
dmesg -T | grep -i xid

# Step 3: check the slot's link, not just the GPU
lspci -vvv -s 0000:0f:00.0 | grep -E "LnkCap|LnkSta"
Good: the count matches, no Xid 79, LnkSta matches LnkCap. A repeated Xid 79 on the same slot after a GPU swap points at the board or the riser. AMD: lspci -d 1002:75a0 (MI350X example) and amd-smi list.
Scenario 2: One GPU runs hot or slow during level 3
# Step 1: watch all eight side by side
nvidia-smi --query-gpu=index,temperature.gpu,clocks.sm,power.draw,clocks_event_reasons.active --format=csv -l 5

# Step 2: read the failure reason in the JSON, not the verdict
grep -i -E "warning|fail" node01_diag.json
Good: all GPUs within a few degrees and at the same clock. One GPU ten degrees hotter than its neighbors is a cold plate, a fan, or a cable blocking airflow. Fix the cooling before touching the GPU. AMD: amd-smi monitor -putm and amd-smi metric -v.
Scenario 3: Memory errors grew during the run
# Step 1: aggregate vs volatile counters (compare with the pre-run snapshot)
nvidia-smi -q -d ECC

# Step 2: row remapping state
nvidia-smi --query-remapped-rows=gpu_uuid,remapped_rows.correctable,remapped_rows.uncorrectable,remapped_rows.pending,remapped_rows.failure --format=csv

# Step 3: the Xid that goes with it
dmesg -T | grep -E "Xid.*(48|63|64|92|94|95)"
Good: zero uncorrectable, no pending remap, no failure. A pending remap needs a reboot. A remap failure means drain the node. AMD: amd-smi metric -e, amd-smi bad-pages, amd-smi ras --cper.
Scenario 4: NVLink or the NVL72 fabric is not healthy
# Step 1: every link active, error counters not growing
nvidia-smi nvlink -s
nvidia-smi nvlink -e

# Step 2 (NVL72): the rack must report a completed fabric, then a healthy IMEX domain
nvidia-smi -q | grep 'Fabric' -A 4
systemctl status nvidia-fabricmanager
nvidia-smi topo -p2p n
nvidia-imex-ctl -q                       # local daemon answers?
nvidia-imex-ctl -N                       # whole domain, needs nodes_config.cfg
grep -E "TRANSIENT_FAILURE|Not all clients" /var/log/nvidia-imex.log

# Step 3: measure it
./nvbandwidth -t device_to_device_memcpy_write_ce
dcgmi diag -r 2 -j
Good: all links active, State: Completed, Status: Success, every pair OK, IMEX connected on every node, copy bandwidth flat across pairs. One slow pair names the link. If the fabric is Completed but IMEX is retrying, fix the node list in nodes_config.cfg and restart nvidia-imex on all nodes. AMD: amd-smi xgmi and TransferBench.
Scenario 5: Two-node all-reduce is low on one pair
# Step 1: port state and rate on both nodes
ibdev2netdev
ibstat | grep -E "State|Rate|Physical"

# Step 2: physical layer on both ends of the link
mlxlink -d mlx5_0 -m -c -e
mlxlink -d mlx5_0 --rx_fec_histogram --show_histogram

# Step 3: the NIC's own PCIe link
mlxlink -d mlx5_0 --port_type PCIE -c

# Step 4: raw RDMA bandwidth without NCCL in the way
ib_write_bw -d mlx5_0 -x 3 -s 65536 -D 60 -q 16 --report_gbits            # server
ib_write_bw -d mlx5_0 -x 3 -s 65536 -D 60 -q 16 --report_gbits 10.0.0.2   # client
Good: effective errors zero, FEC bins near empty, PCIe at rated width, ib_write_bw within about 5 percent of line rate. If RDMA is fine and NCCL is still low, the problem is configuration or topology, not the cable. If both are low, swap in a known-good node and rerun. At scale, bisect.
Scenario 6: Checkpoints are slow
# Step 1: is it the network?
iperf3 -c storage01 -P 8 -t 30

# Step 2: is it the storage?
fio --name=ckpt --directory=/mnt/ckpt --rw=write --bs=1M --size=10G --numjobs=8 --direct=1 --group_reporting
Good: both numbers near the design values. If the east-west tests were clean, a slow checkpoint is a north-south problem, and no amount of GPU swapping will fix it.
The Ten Commandments: Commands to Run on Every New Node
nvidia-smi -L                                                             # 1. count and identity
nvidia-smi --query-gpu=name,serial,driver_version,vbios_version,pcie.link.gen.current,pcie.link.width.current --format=csv   # 2. golden settings
nvidia-smi nvlink -s                                                      # 3. every link active
nvidia-smi -q -d ECC                                                      # 4. baseline memory errors
dmesg -T | grep -i xid                                                    # 5. anything already logged
dcgmi diag -r 3 --fail-early -j > diag.json                               # 6. readiness under load
./nvbandwidth -t device_to_device_memcpy_write_ce                         # 7. inside the box
ibstat | grep -E "State|Rate|Physical"                                    # 8. every NIC up at rate
mlxlink -d mlx5_0 -m -c -e                                                # 9. physical layer clean
mpirun -np 8 ./build/all_reduce_perf -b 8 -e 8G -f 2 -g 1 -c 1            # 10. correct and fast
On AMD, the first four become amd-smi list, amd-smi static -b -d, amd-smi xgmi, and amd-smi metric -e, and step six becomes rvs or an AGFHC recipe. On an NVL72 rack, add an eleventh: nvidia-imex-ctl -q, then -N once the domain is defined.
AI Agents: Automating the Loop
Everything above can be done by hand. At a hundred thousand nodes, manual ways mean death. Teams that commission hardware build an orchestrator, either in-house or on top of Slurm or Kubernetes. I have done the first two.
The pipeline has a few moving parts. A state store keeps track of which stage each node is in and what has happened to it. A test runner runs one stage on one node, using the right tool version, and saves the raw output. A checker compares that output with the target numbers for that hardware type and cluster size, then answers pass, warn, or fail, with a reason. A classifier takes a failure and sorts it into a fault type (GPU memory, NVLink or fabric, PCIe, RDMA link, optic, cable, thermal, firmware, setup) and suggests what to do next (retest, reset, power cycle, reseat, replace, escalate). A ticket carries the evidence to whoever does the repair, and the result comes back into the store. AMD’s public Kubernetes reference design is one example. New nodes land in a staging cluster, a node problem detector checks GPU and NIC health, the field health check runs as a job, and a node that fails goes to retry, automatic fix, manual return, or quarantine.
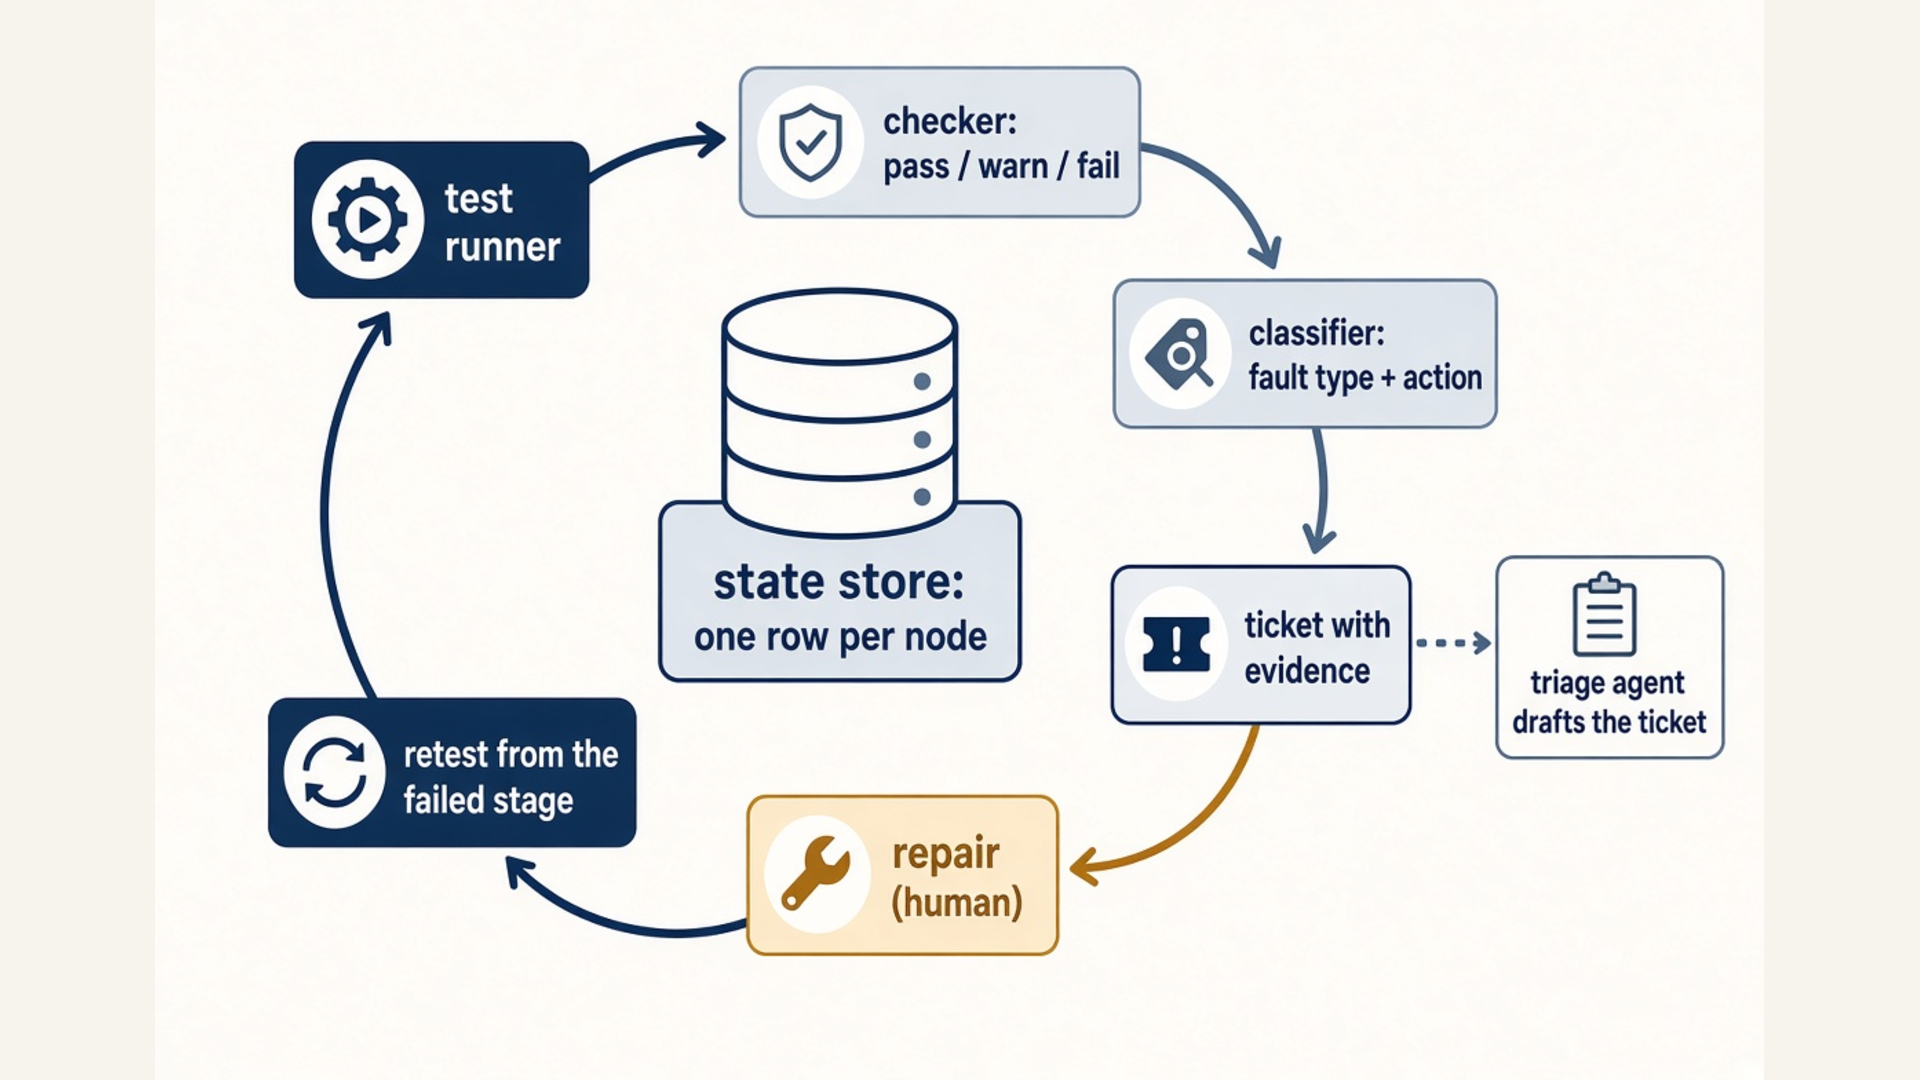
The good orchestrators all follow the same rules:
- Only a clear pass counts as a pass. No result, or a timed-out result, is a fail. A test that never started is a tooling problem, not a pass and not a hardware fault.
- Every automatic action has a limit. One rerun, one reset, one power cycle per test per day is typical. After that, a person gets a ticket with the evidence attached.
- Asking for a fix is not a fix. A reset that was accepted, or a ticket that was closed, proves nothing. The node has only recovered when it passes a later run.
- Advice is not action. The classifier suggests. The orchestrator writes down whether the advice was taken, overruled, or ignored.
- Keep the evidence. Tie every decision to the exact run that caused it, and save the raw logs before anything gets reset.
How can AI help? The newest piece is the triage agent. This is a language model that reads the evidence, the node’s recent history, and old tickets and runbooks, then writes the repair ticket a person would have written. On a big cluster, writing those tickets is where the hours go, so this is where an agent earns its keep. The teams that do this well keep a firm line between what the agent does and what people do.
| Deterministic code decides | The agent helps with | A human decides |
|---|---|---|
| Parsing logs into typed signals; matching a fault to an approved rule; deduplicating tickets; authorizing any action | Summarizing the evidence; proposing a candidate repair when no rule matches; drafting the ticket with the exact device, port, cable serial, and validation step | Every physical action: reseat, swap a cable or optic, replace a GPU or board |
Two more rules for the agent. If the model fails or is not sure, send the node to a person, never mark it “healthy”. And judge the agent by results, not by what it says about itself: what share of failures got a useful recommendation, and how many of those turned out to be the real fix.
What the Field Reports
One machine in ten did not boot. When Imbue brought up about 4,000 H100 GPUs, roughly ten percent of the machines failed to come up healthy the first time, and roughly ten percent of the InfiniBand links kept dropping. The causes were the usual suspects: cables, transceivers, airflow, and configuration. Always remember this and plan for it.
The same forty nodes kept breaking. Meta studied two research clusters and found that forty specific nodes caused far more than their share of failures. Normal health checks passed them anyway. Pulling those “lemon nodes” out cut the failure rate of large jobs from fourteen percent to four percent. Commissioning is the start of a node’s record, not the end of it.
Most interruptions were hardware, and the job survived anyway. During 54 days of Llama 3 training, Meta counted 419 unexpected interruptions, about three quarters of them hardware. The run still spent over ninety percent of its time doing useful work, because problems were caught and restarts were fast. Throughput also moved one to two percent with the afternoon temperature, so log temperature and clock speeds with every result.
The facts match what Imbue and Meta published. I read those docs and learned from them. So should you. They are there in the appendix.
Conclusion
Freeze the configuration. Test from the inside out. Measure against what you expected. Write the pass criteria before the first run. Keep the record.
None of this needs special tools. Everything above is public, and the commands in this post are enough to start today. The hard part is not the software. The hard part is discipline: rerunning before replacing, writing “unassessed” instead of “pass”, saving the boring logs nobody will read for six months. That discipline feels expensive right up until the day a 1,024-GPU run stalls and nobody can say what changed.
In God we trust. All others bring data. (Usually attributed to W. Edwards Deming.)
References
- NVIDIA DCGM Diagnostics: https://docs.nvidia.com/datacenter/dcgm/latest/user-guide/dcgm-diagnostics.html
- NVIDIA Xid Errors catalog: https://docs.nvidia.com/deploy/xid-errors/latest/analyzing-xid-catalog.html
- NVIDIA nvidia-smi reference: https://docs.nvidia.com/deploy/nvidia-smi/index.html
- NVIDIA Multi-Node NVLink Systems user guide, verifying and troubleshooting (NVL72 fabric and IMEX): https://docs.nvidia.com/multi-node-nvlink-systems/mnnvl-user-guide/verifying.html and https://docs.nvidia.com/multi-node-nvlink-systems/mnnvl-user-guide/troubleshooting.html
- NVIDIA IMEX service guide: https://docs.nvidia.com/multi-node-nvlink-systems/imex-guide/index.html
- NVIDIA nccl-tests and its performance notes (algbw, busbw): https://github.com/NVIDIA/nccl-tests and https://github.com/NVIDIA/nccl-tests/blob/master/doc/PERFORMANCE.md
- NVIDIA nvbandwidth: https://github.com/NVIDIA/nvbandwidth
- NVIDIA MFT mlxlink utility: https://networking-docs.nvidia.com/mftswum/4.36.0/mlxlink-utility
- NVIDIA HGX AI Factory network architecture (east-west and north-south): https://docs.nvidia.com/enterprise-reference-architectures/hgx-ai-factory/latest/network-logical-architecture.html
- linux-rdma perftest (ib_write_bw and friends): https://github.com/linux-rdma/perftest
- gpu-burn: https://github.com/wilicc/gpu-burn
- AMD Instinct Customer Acceptance Guide, including RDMA benchmarking thresholds: https://instinct.docs.amd.com/projects/system-acceptance/en/latest/index.html and https://instinct.docs.amd.com/projects/system-acceptance/en/latest/network/rdma-benchmarking.html
- AMD SMI CLI and RAS: https://rocm.docs.amd.com/projects/amdsmi/en/latest/how-to/using-AMD-SMI-CLI-tool.html and https://rocm.docs.amd.com/projects/amdsmi/en/latest/conceptual/ras.html
- ROCm Validation Suite: https://github.com/ROCm/ROCmValidationSuite
- AMD GPU Field Health Check (AGFHC) recipes: https://instinct.docs.amd.com/projects/gpu-operator/en/latest/test/agfhc.html
- AMD Cluster Validation Suite: https://rocm.docs.amd.com/projects/cvs/en/latest/what-is-cvs.html
- AMD Kubernetes reference architecture, GPU server intake (staging cluster, node problem detector, AGFHC job, remediation, quarantine): https://instinct.docs.amd.com/projects/advanced-micro-devices-k8s-reference-arch/en/latest/reference/gpu-server-intake.html
- Manufacturing levels L6 to L12: AMAX https://www.amax.com/server-manufacturing-levels-defined/ and Glenn K. Lockwood https://www.glennklockwood.com/garden/manufacturing-level
- NVIDIA product pages: H100 https://www.nvidia.com/en-us/data-center/h100/ , H200 https://www.nvidia.com/en-us/data-center/h200/ , HGX https://www.nvidia.com/en-us/data-center/hgx/ , GB200 NVL72 https://www.nvidia.com/en-us/data-center/gb200-nvl72/ , GB300 NVL72 https://www.nvidia.com/en-us/data-center/gb300-nvl72/ , Rubin announcement https://nvidianews.nvidia.com/news/rubin-platform-ai-supercomputer
- AMD product and news pages: MI300X https://www.amd.com/en/products/accelerators/instinct/mi300/mi300x.html , MI325X https://www.amd.com/en/newsroom/press-releases/2024-10-10-amd-delivers-leadership-ai-performance-with-amd-in.html , MI355X https://www.amd.com/en/products/accelerators/instinct/mi350/mi355x.html , Helios https://newsroom.amd.com/news/amd-and-meta-announce-expanded-strategic-partnersh/ and https://www.nextplatform.com/compute/2026/02/23/amd-says-helios-racks-and-mi400-series-gpus-on-track-for-2h-2026/4092199
- OCI documentation, Compute Shapes (GPU bare metal shapes and per-node RDMA bandwidth): https://docs.oracle.com/en-us/iaas/Content/Compute/References/computeshapes.htm
- OCI documentation, High Performance Computing and RDMA cluster networks: https://docs.oracle.com/en-us/iaas/Content/Compute/References/high-performance-compute.htm
- OCI blog, “First Principles: Inside Zettascale OCI Superclusters”: https://blogs.oracle.com/cloud-infrastructure/first-principles-zettascale-oci-superclusters
- OCI blog, “First Principles: Superclusters with RDMA”: https://blogs.oracle.com/cloud-infrastructure/superclusters-rdma-high-performance
- OCI blog, “First Principles: Oracle Acceleron Multiplanar Networking Architecture” and the video with Pradeep Vincent, Jag Brar, and David Becker: https://blogs.oracle.com/cloud-infrastructure/first-principles-acceleron-multiplanar-networking and https://www.youtube.com/watch?v=7Tqovn_5-DU
- OCI blog, “Zettascale in Practice: OSU and NCCL Benchmark on NVIDIA H100 GPU Clusters” (the measured RDMA and NCCL numbers above): https://blogs.oracle.com/cloud-infrastructure/zettascale-osu-nccl-benchmark-h100-ai-workloads
- OCI blog, “Behind the Scenes: Scale your NVIDIA GB200 NVL72 deployments with dedicated OCI APIs”: https://blogs.oracle.com/cloud-infrastructure/behind-the-scenes-scale-nvidia-gb200-nvl72-deployments
- OCI GPU quickstarts (per-shape health checks): https://github.com/oracle-quickstart/oci-gpu-quickstarts
- OCI active health checks on OKE (scheduled NCCL, RCCL, DCGM, stress jobs): https://github.com/oracle-quickstart/oci-hpc-oke/blob/main/docs/running-active-health-checks.md
- OCI GPU Scanner (passive and active checks for NVIDIA and AMD; passive checks ship in the Dr.HPC V2 binaries): https://github.com/oracle-quickstart/oci-gpu-scanner
- Together AI, a practitioner’s guide to testing large GPU clusters: https://www.together.ai/blog/a-practitioners-guide-to-testing-and-running-large-gpu-clusters-for-training-generative-ai-models
- Imbue, from bare metal to a 70B model: https://imbue.com/research/70b-infrastructure/
- Kokolis et al., “Revisiting Reliability in Large-Scale Machine Learning Research Clusters”, HPCA 2025: https://arxiv.org/abs/2410.21680
- Grattafiori et al., “The Llama 3 Herd of Models”, section 3.3.4: https://arxiv.org/abs/2407.21783
- Microsoft Azure HPC, DGX Cloud benchmarking on Azure: https://techcommunity.microsoft.com/blog/azurehighperformancecomputingblog/dgx-cloud-benchmarking-on-azure/4410826
- Rik Kisnah, “Three Weeks in Batam: Bringing NVIDIA GB200 to Life on the Data Plane”: https://www.rik-kisnah.ai/posts/gb200-batam-data-plane-rollout/
- Rik Kisnah, The Complete NCCL Reference Guide: https://www.rik-kisnah.ai/posts/nccl-complete-reference-guide/